Claude Models Detect Four Data Leakage Patterns in Benchmark Tests
- Cargo
- Machine Learning
- Shipped
- Shipper
- Nate Rosidi
- Readers
- 619
Four Claude models identified planted leakage in real pipelines, while their ability to catch adjacent problems varied by model.


A model’s striking score can reflect what slipped into its data pipeline rather than useful predictive skill. In a test across four real projects, four Claude models identified the specific leakage pattern in every case when asked to inspect a pipeline before seeing its results. They were less consistent at spotting a second flaw alongside the first.
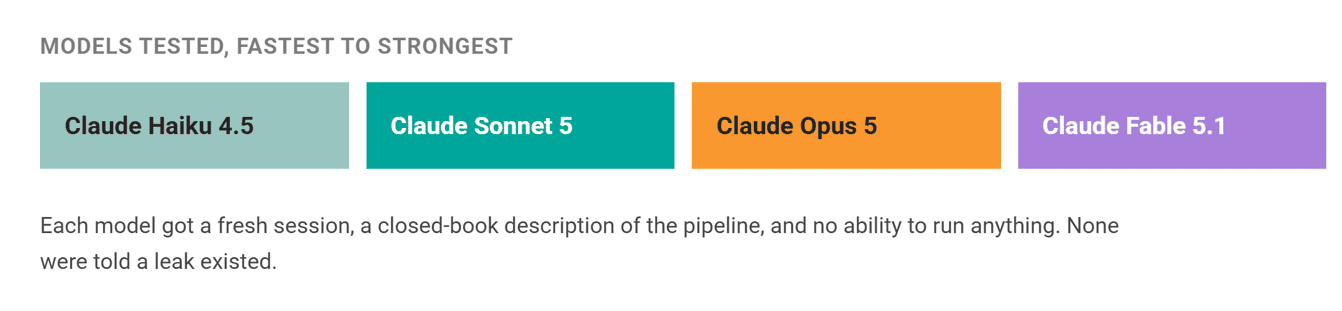
The experiment paired performance measurements with a separate, blind review. Researchers introduced one established leakage pattern into each project, trained models with and without the leak, then described the pipeline to Claude Haiku 4.5, Sonnet 5, Opus 5 and Fable 5.1. Each model received a fresh session, no information that a leak was present, and no ability to run code. The test covered only Claude models, so it doesn’t establish how they compare with other AI systems.
When a feature contains the answer
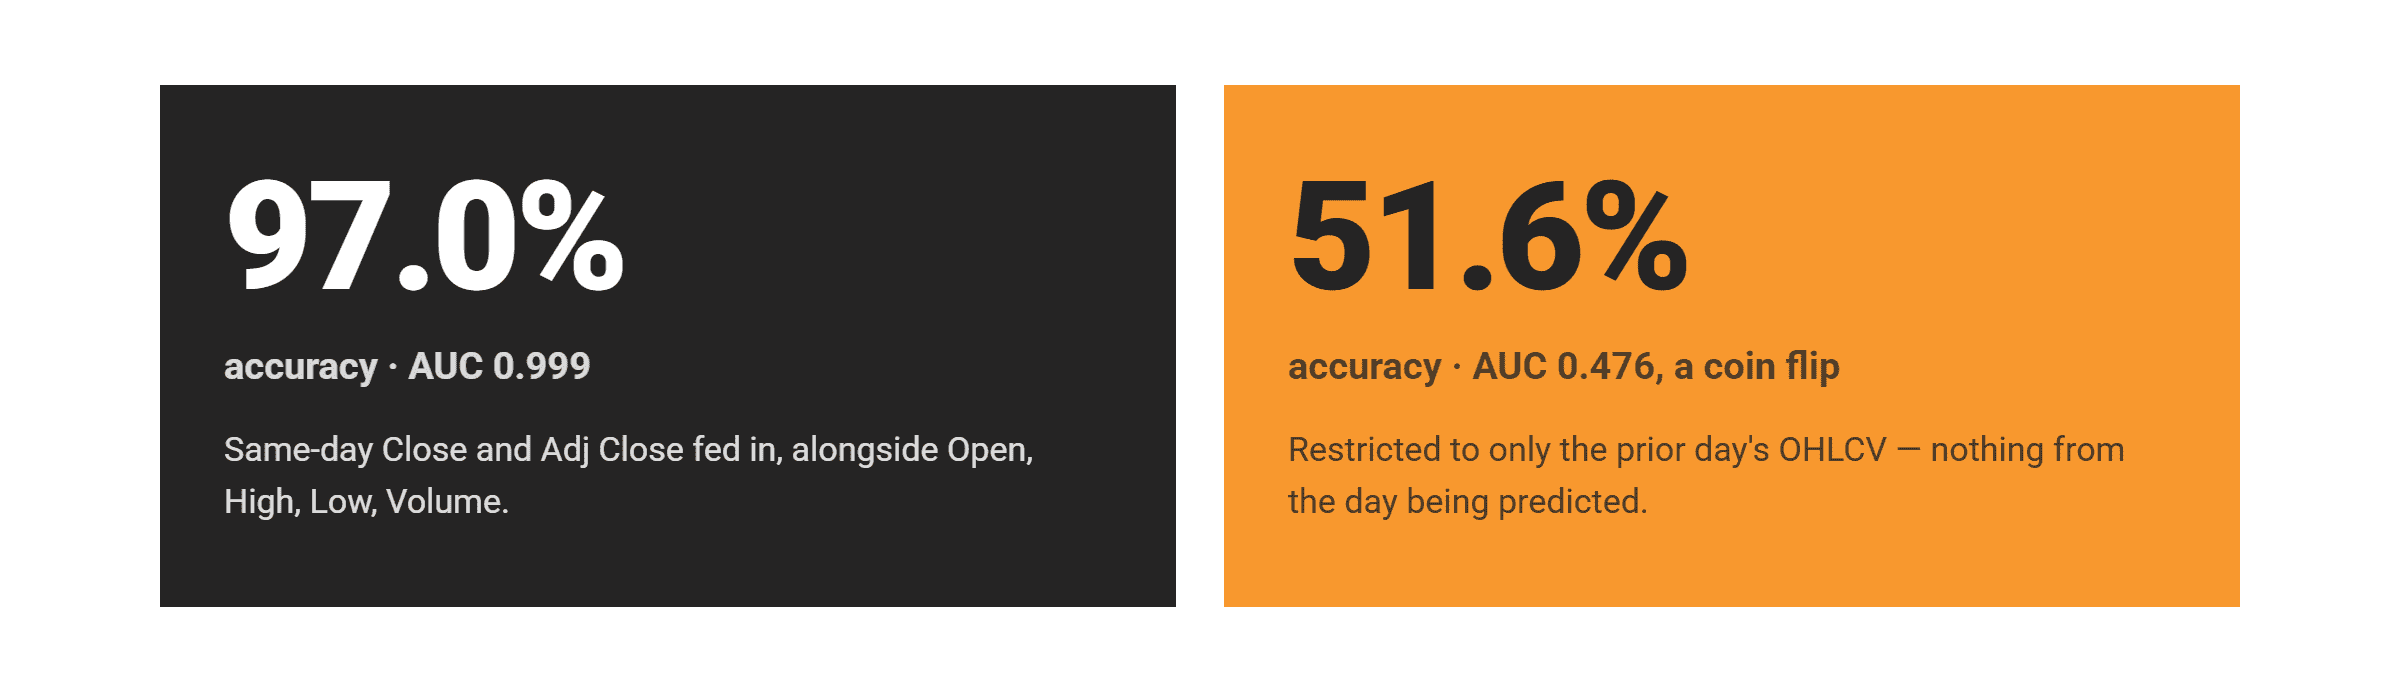
The first project predicted whether Amazon’s closing price was above its opening price on the same day. Its label was defined directly from those two values: 1 when Close exceeded Open, and 0 otherwise. Including that day’s closing price among the inputs gives the model information that would not be available when making a prediction before the market closes.
With same-day Close and Adj Close included alongside Open, High, Low and Volume, validation accuracy reached 97.0% and AUC reached 0.999. Restricting the model to the prior day’s open, high, low, close and volume brought accuracy down to 51.6% and AUC to 0.476. That result is near chance, while the inflated score came from a feature that effectively encoded the label. The datasets came from Prediction of Stock Price Direction.

All four models recognized the circular relationship. Haiku described it as “circular,” and Sonnet noted the label could be reconstructed with one comparison. Opus also pointed out that if the day’s high equals its open, the price never rose above the open, so the label must be 0. It predicted that a fair model might score in the low 50s, close to the clean run.
Delivery estimates can leak through time and aggregation
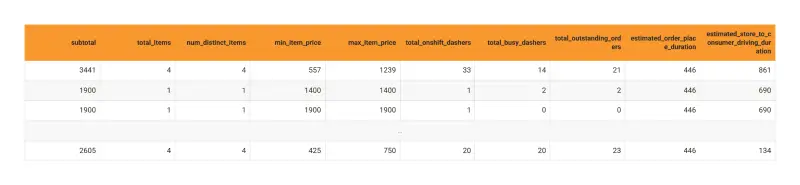
The delivery-duration case used a subset of DoorDash’s historical_data.csv, containing 197,428 orders across 16 columns. The target, duration_sec, measures the seconds between created_at and actual_delivery_time. The experiment excluded market, restaurant-category and order-channel fields, then added a store-level average duration.
In the leaked version, that average was calculated across the full dataset, including rows later used for evaluation. Because it averages the target itself, the feature can carry a smoothed version of the answer, especially for stores with few orders. The split also shuffled timestamped records before assigning 80% to training and 20% to testing. That allows the model to train on orders that occurred later than some test orders.
The clean version calculated store averages from training-period orders only, mapped those values onto training and test rows, and split the data chronologically. Its root mean squared error (RMSE), measured in seconds, was 949.9, compared with 862.7 for the leaked pipeline. The apparent improvement of about 9% came from information that would not be available in the intended prediction setting. Average delivery time was about 47 minutes, with a median of 44 minutes; the clean model’s error therefore represents a substantial share of a typical delivery.
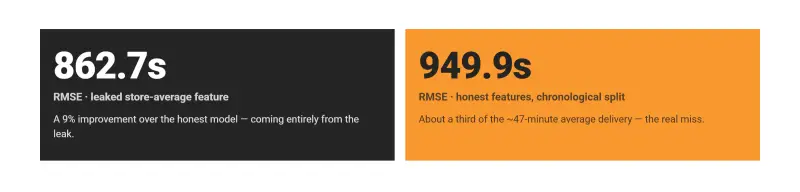
All four models flagged the store-average feature. Sonnet, Opus and Fable also noticed the random split’s time-order problem; Haiku missed it. Fable clearly described how training could include orders placed after test orders. Opus added that the dataset already offered a baseline: estimated_order_place_duration plus estimated_store_to_consumer_driving_duration. Without comparing against that estimate, the RMSE alone gives limited context. The project data is available at Delivery Duration Prediction.
Repeated users can cross a row-level split
The fraud-detection project joined a users table, where IS_FRAUDSTER is assigned per person, to a transactions table with multiple rows per user. A random split of the joined rows put transactions from 1,950 of 2,246 users in both the training and test sets. The model could therefore encounter a person during training and then be evaluated on another transaction from that same person.
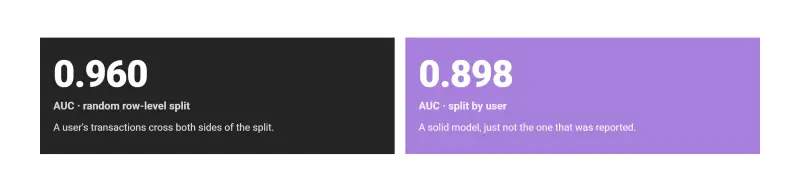
With the random row split, AUC was 0.960. Splitting by user so that no person appeared on both sides reduced AUC to 0.898. The latter is the more relevant estimate when the intended task is to classify users the model has not seen before. All four models identified the mismatch between the label’s user-level meaning and the transaction-level split.
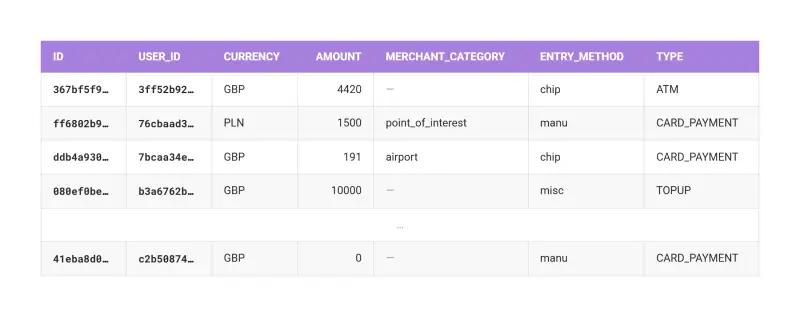
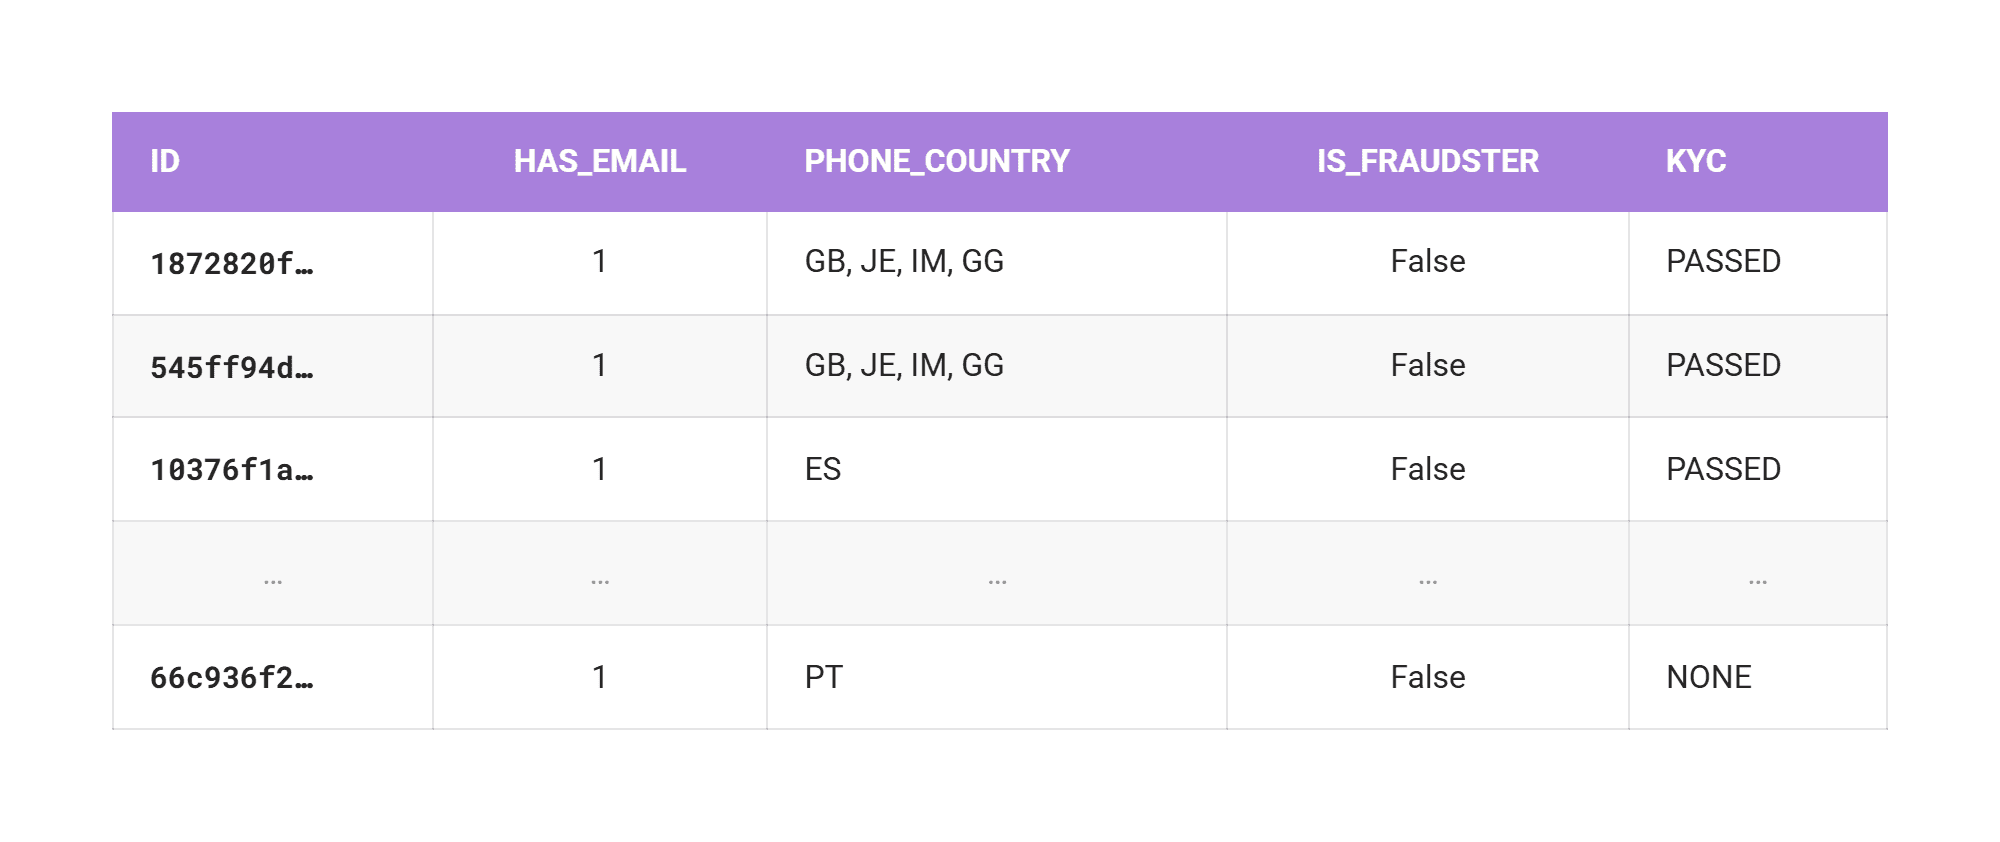
Opus noted that the effective sample size is the number of users, not the number of transactions, and warned that fields populated after a fraud investigation could leak outcomes too. The experiment found an especially direct example: account status was ACTIVE for every non-fraudster and LOCKED for every fraudster, so the field was removed. The data comes from Fraudsters Detection (Revolut).
Oversampling before the split duplicates test examples
The loan project predicted bad_flag using fields including dpd_30_cnt, past_billings_cnt and two credit scores. About 10% of loans had a positive label, so the pipeline duplicated minority-class rows to address the imbalance. The order of operations determined whether duplicate examples could cross into the test set.
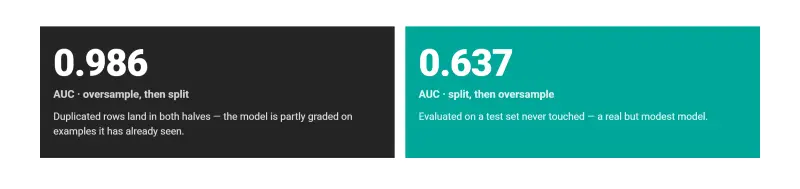
Oversampling the full dataset before a train-test split produced an AUC of 0.986. Splitting first and oversampling only the training portion produced 0.637 on an untouched test set. In the first setup, copies of the same loan could appear in both sets, letting the model be evaluated on examples it had effectively seen already.
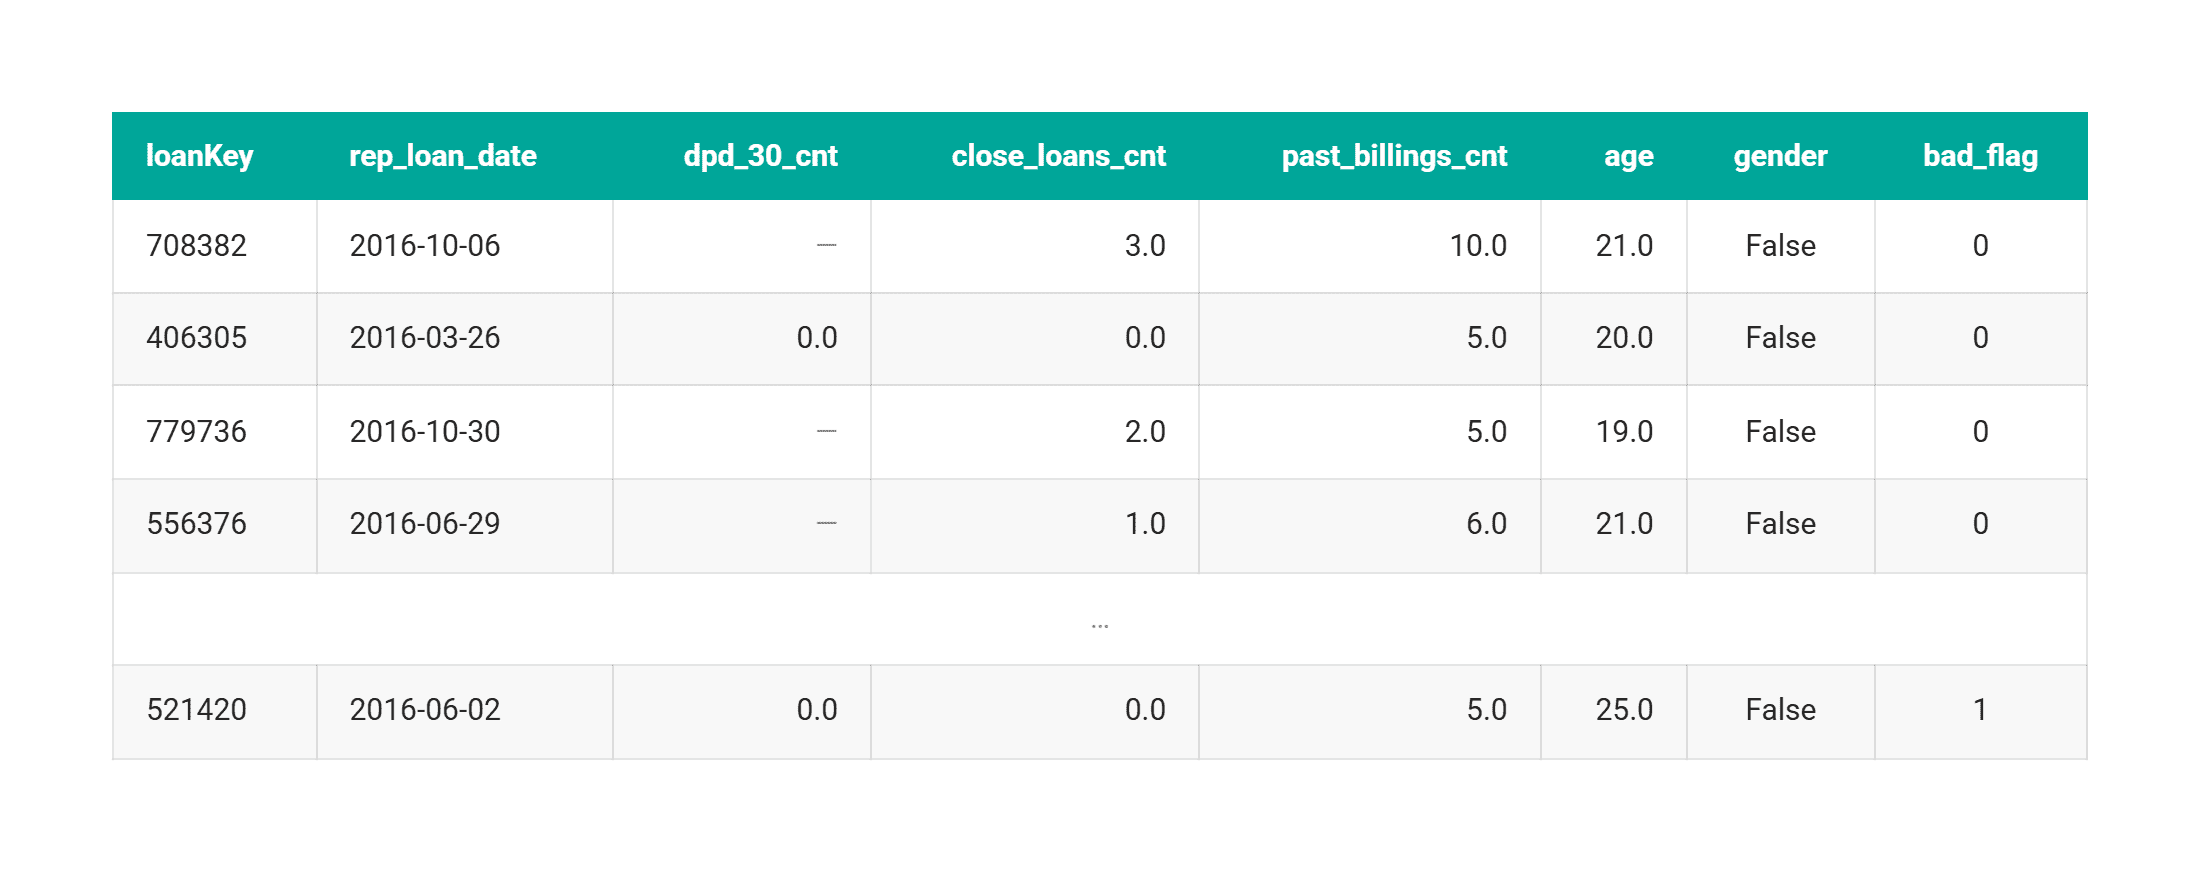
All four models caught the problem from the code alone, without data or metrics. Opus also observed that stratifying after balancing the labels adds little value. It raised alternatives such as classifier weighting and measuring recall at a fixed review capacity rather than relying on ROC AUC. The project data is listed under Flagging Loans (Chime).
What the test says about AI pipeline checks
Each model found the planted leak in all four cases. The differences appeared in the additional scrutiny they offered. Haiku tended to give concise answers, but in the delivery case it missed the chronological-split issue after identifying the leaked store average. Sonnet and Fable caught both problems there. Opus most often extended its review: it estimated a plausible clean score, suggested a baseline, identified an extra feature leak, and questioned whether the proposed evaluation metric or correction was appropriate.
These results support using an AI model as an early pipeline reviewer, especially when its task is clearly framed and it can inspect the relevant code and data definitions. They don’t show that a model will uncover every flaw: the test used four known patterns, four Claude variants and written descriptions, with no execution. A reviewer also needs enough context to understand when each feature becomes available and what entity the prediction concerns.
The practical lesson is to ask for a leakage review before trusting a high score, then check each concern against the actual split, feature timing and prediction unit. The experiment shows that this quick review caught the planted errors consistently; finding the second problem can still depend on the model and the detail provided.