Flint-interactive Gives AI Agents a Higher-Level Language for Interactive Charts
- Cargo
- Machine Learning
- Shipped
- Shipper
- Chenglong Wang, Yuwei Xiao, Alper Sarikaya, Michel Galley, Chris Quirk, Jianfeng Gao
- Readers
- 696
Flint-interactive maps user selections to chart updates, helping agents build linked visualizations and dashboards with less low-level rendering work.
Interactive charts can turn an AI-generated report into a space for exploration: readers can select data, compare views, or use a chart selection to focus related text. Building those behaviors reliably is still costly. Flint-interactive addresses that gap with a higher-level language for describing what a user does and how a visualization should respond.
Why interaction is difficult to generate
AI agents can analyze data and produce visualizations, but a static chart limits readers to the view chosen by its creator. Adding custom interactions often means repeated rounds of code generation, reasoning, and debugging. That takes time and tokens, and changes meant to fix one issue can introduce another, such as a broken interaction or poor layout.
Built-in interactions in visualization libraries cover common needs, but may not express the bespoke behavior a chart requires. Flint’s premise is that agents need a language that describes interactions at a useful level of abstraction, while leaving the low-level work of connecting events to rendered changes to a compiler.
From selections to linked updates
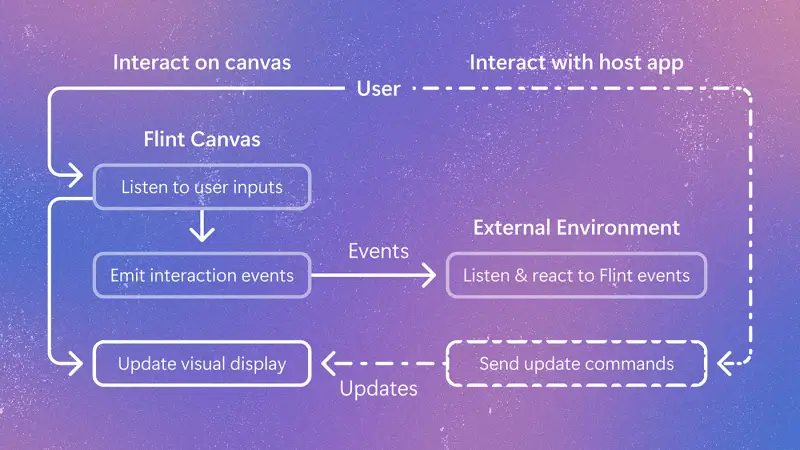
Flint-interactive builds on Flint to support interactive charts, dashboards, data stories, and other connected artifacts. A user or agent specifies interaction logic through semantic events and update operators. The compiler interprets those specifications and manages the visual dependencies involved in applying an update.
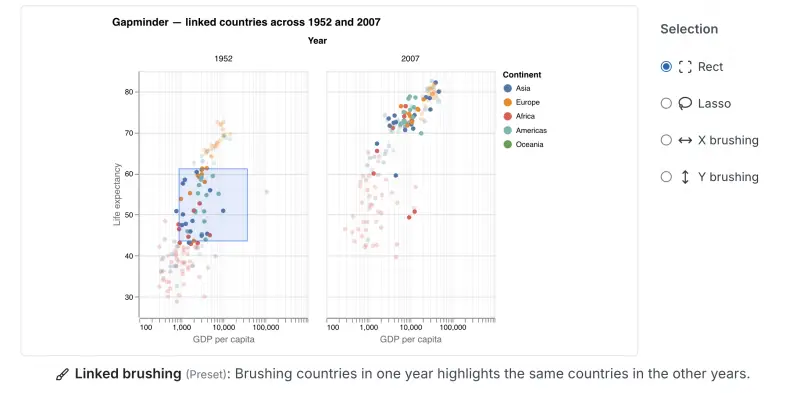
For example, selecting a group of countries in one Gapminder scatterplot can highlight the same countries in a second view showing a different year. Flint offers a preset called linked-brush for this pattern. The selection can help a reader compare how the chosen group relates across views without requiring a developer to hand-code each chart’s rendering details.
Three ways to use Flint-interactive
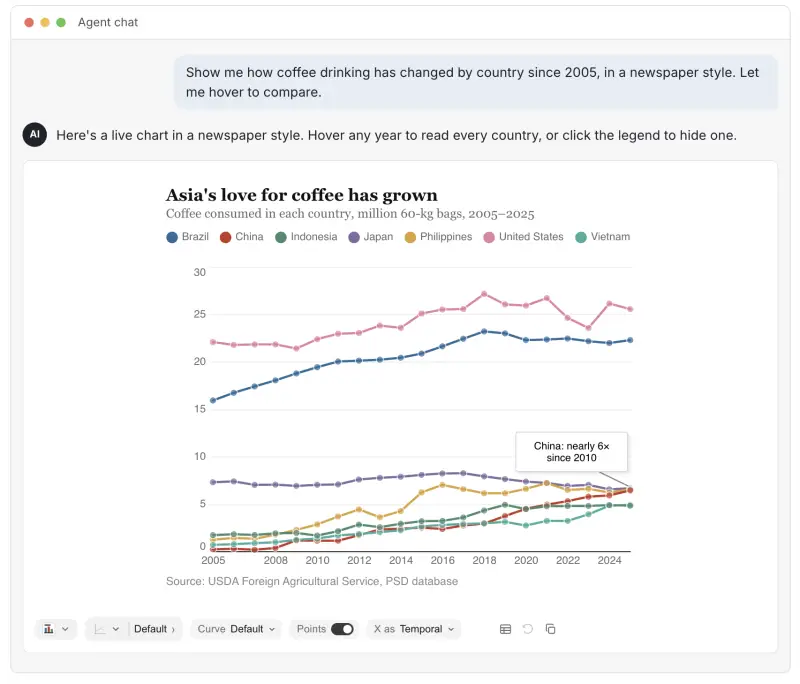
For chat or canvas workflows, Flint-interactive can be used through Flint-MCP and MCP Apps, following the setup guide. A user can ask an agent for a chart and specify desired interactions; the agent can produce an interaction_spec alongside a Flint chart specification and render the result in the conversation. Users can then select part of the chart and carry that context into a follow-up turn.
For application builders, Flint Interactive Canvas can power charts inside a dashboard, data story, or other app. Event handlers receive semantic events from the canvas and can use them to filter a table, update another chart, or change application state. An app can also send update operators to the canvas so its own widgets control chart behavior.
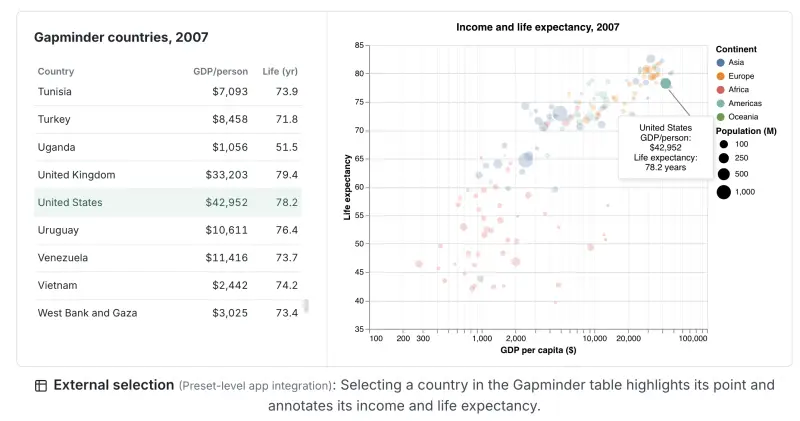
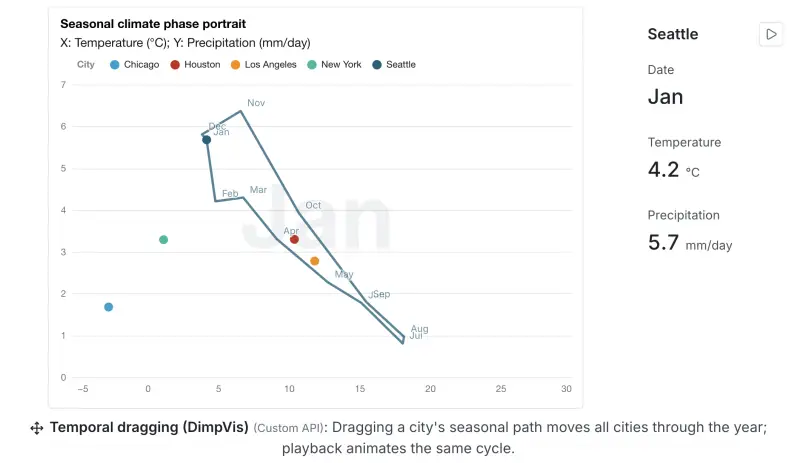
For interactions beyond the presets, developers can define a trigger and custom handler through Flint’s programming API. A handler can respond to a semantic event by combining operators such as set-style to highlight a mark and set-annotation to label it. That keeps the interaction focused on the intended result instead of requiring direct manipulation of renderer-specific marks.
How the interaction model works
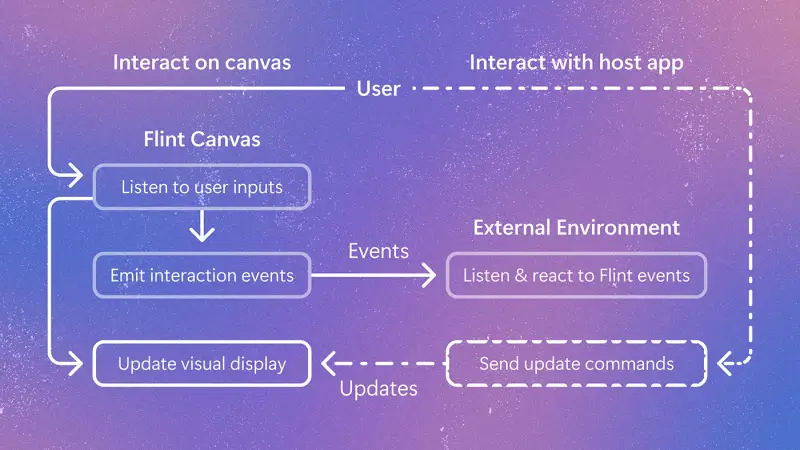
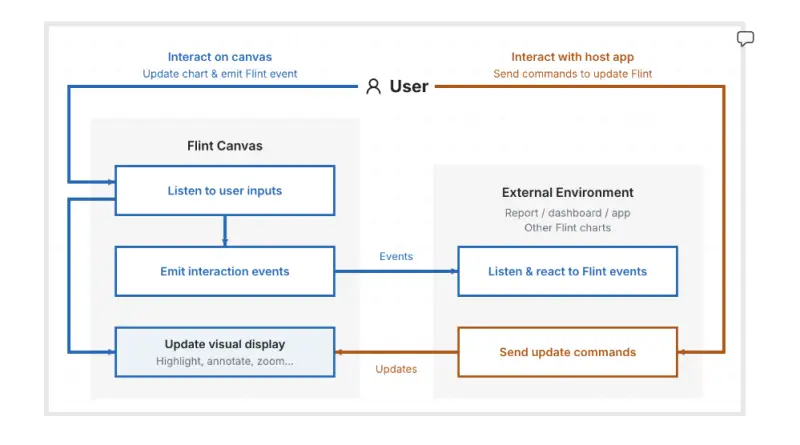
Flint Canvas acts as a state machine, tracking user input and the canvas’s visual state. Its compiler translates raw actions, such as clicks, drags, and key presses, into semantic events that identify the selected chart elements and data. It also translates update operators into canvas changes, handling hit testing and other lower-level rendering work.
The user defines the interaction logic by mapping those semantic events to updates. Operators can change a mark’s style, add an annotation, or adjust the viewport for panning and zooming. The same events can drive updates outside the chart, including changes to tables, text, widgets, or application state. This separation makes interaction specifications easier to maintain because authors work with the meaning of a selection rather than the rendering machinery behind it.
Flint’s compositional event and update model also provides a way to connect different parts of an application. A chart can respond to a table selection, while a chart selection can update a paragraph or another view. For teams building data stories and dashboards, that offers a shared interaction model across the visualization and its surrounding interface.
Where developers can start
Chart users can follow the Flint chat setup guide and try examples from the interaction gallery. App builders can consult the interaction API to add connected behavior to dashboards and data stories. Designers can explore bespoke interaction examples and develop reusable presets.
The practical test for Flint-interactive will be whether its higher-level specifications reduce iteration while still giving teams enough control over the behavior they need. Its design targets a clear source of friction: translating a user’s action into consistent updates across charts and application elements. That makes it a useful approach to evaluate when an agent-generated visualization needs to support exploration beyond a single static view.