Phison Pascari X201P Review: 12 GB/s Writes and Strong AI Checkpoint Results
- Cargo
- Machine Learning
- Shipped
- Shipper
- Shane Downing
- Readers
- 386
The 15.36TB X201P sustains 12 GB/s writes and excels at AI checkpoint saves, but its QD1 latency and moderate-load results have tradeoffs.
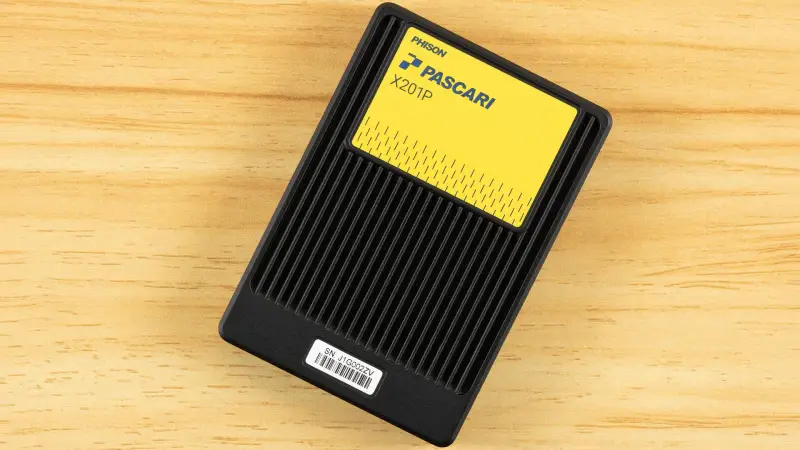
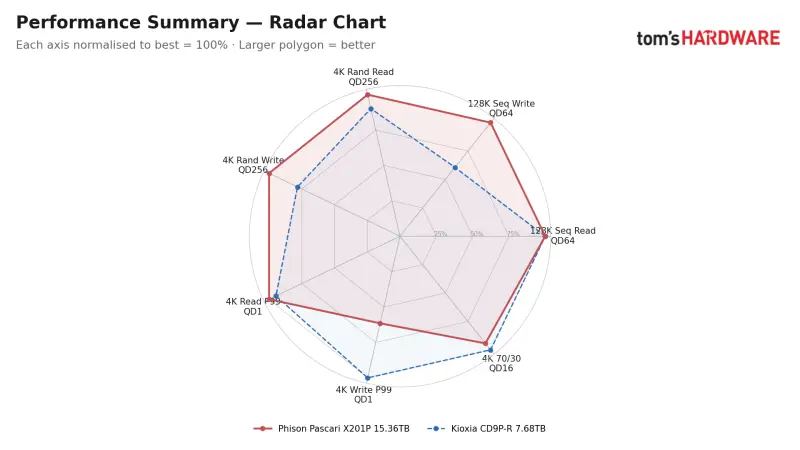
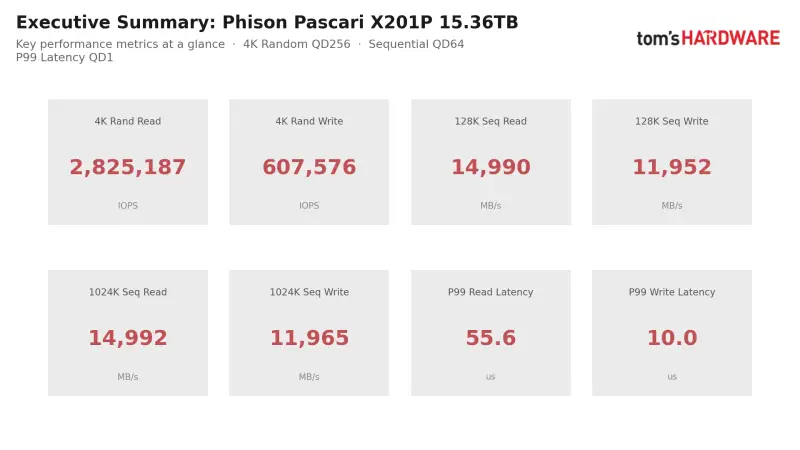
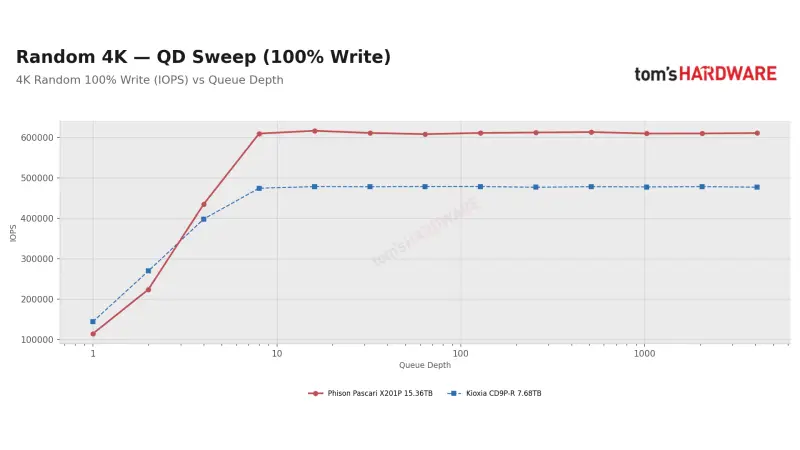
Phison’s 15.36TB Pascari X201P makes its strongest case with sustained write throughput. In testing, it held about 12 GB/s in sequential writes and more than 600,000 4K random write IOPS for an hour. Those results stand out for a drive rated at 1 drive write per day (DWPD), and make it a good fit for checkpoint saves, data ingest and heavily loaded storage tiers.
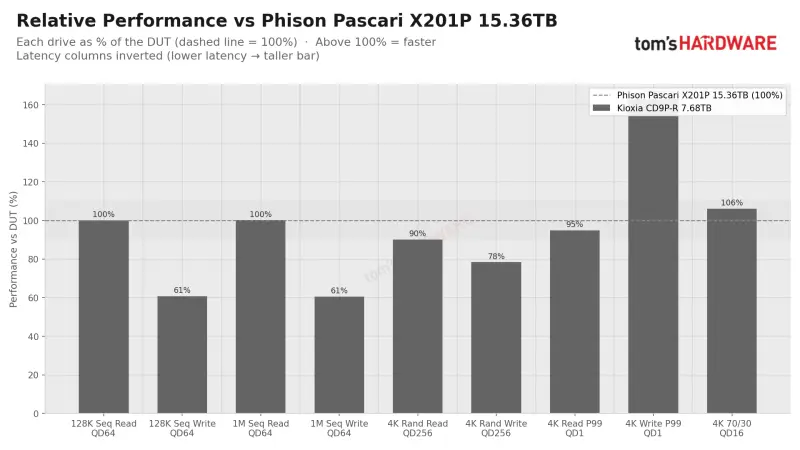
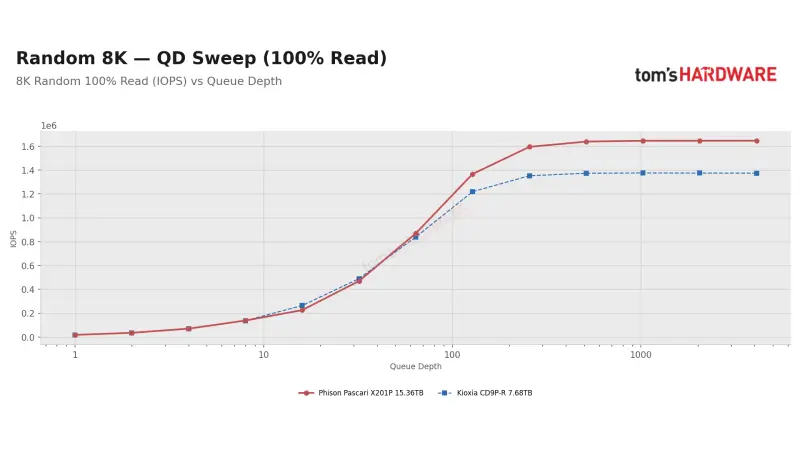
The tradeoff is workload sensitivity. The X201P is quick once requests build up, but it trails the Kioxia CD9P-R in some shallow and moderate queue tests, including QD1 writes and simulated database log commits. It also has a specific weakness in 8K reads around QD16. My read is that this is a strong throughput drive for write-heavy service, with latency and queue depth worth checking against the intended workload before deployment.
Where the X201P fits
The X201P is Phison’s read-intensive PCIe 5.0 data center SSD and a successor to the X200P. It belongs to the Pascari Performance X-Series, aimed at demanding workloads where consistent service matters. The product line spans U.2 capacities from 1.92TB to 30.72TB, plus E3.S models starting at 3.84TB. Single-port and dual-port versions are offered. The dual-port models use a 2x2 link configuration.
Its sibling, the Pascari X201E, is the mixed-use option rated for 3 DWPD. The X201P is rated at 1 DWPD across the listed capacities. That distinction matters: the drive’s high write results don’t change its stated endurance class. Buyers should match daily write volume and expected service life to the drive’s rating, alongside throughput requirements.
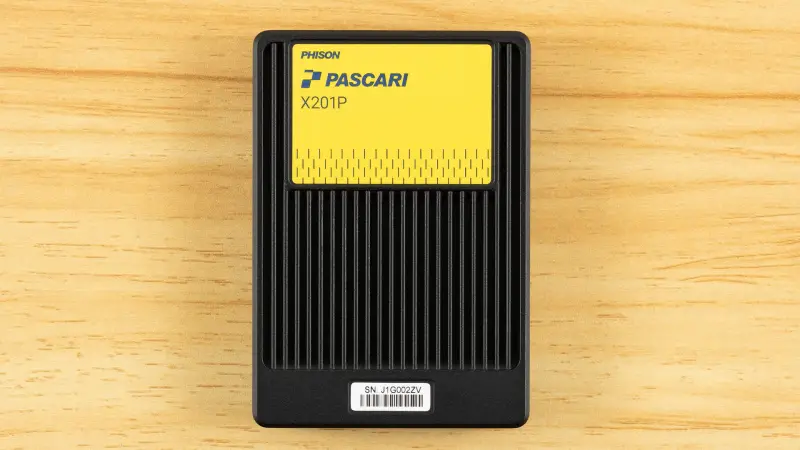
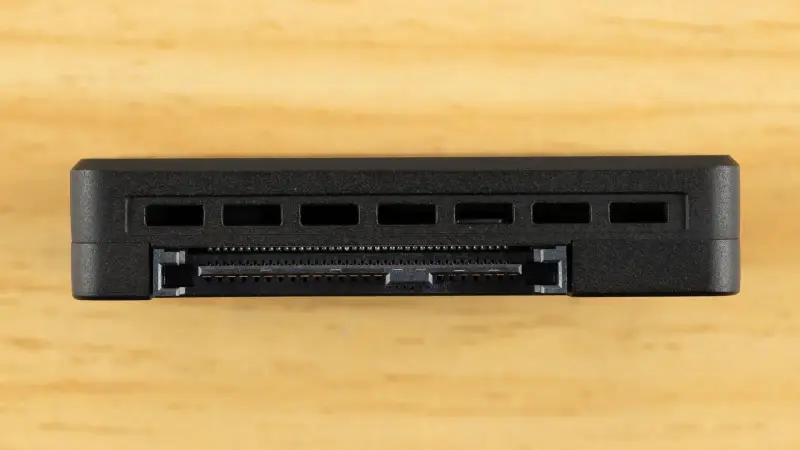
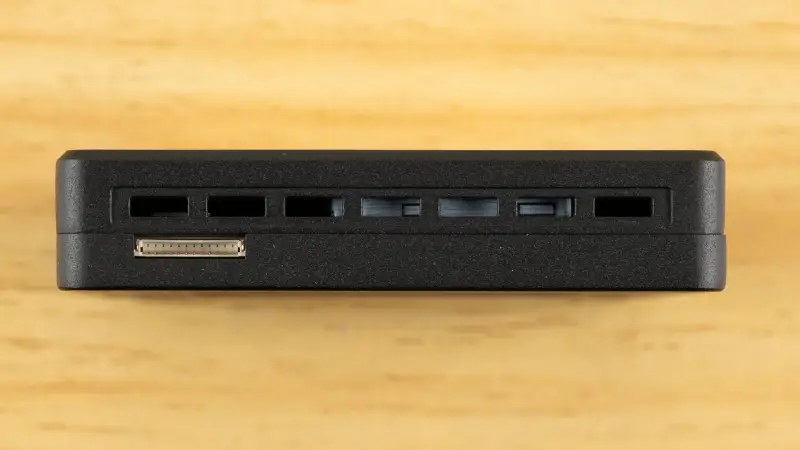
The tested model uses a U.2, 15mm-high enclosure, PCIe 5.0 x4 and NVMe 2.0d. It has a Phison X2 controller, DRAM whose capacity Phison has not published, and 3D TLC flash. The 15.36TB version is specified with 321-layer TLC. Phison lists maximum active power of 25W and idle power of 5W, a five-year warranty, power-loss protection, and security options including instant secure erase (ISE) or a self-encrypting drive (SED) using TCG Opal 2.02.
Specifications and management
Capacity changes the rated performance substantially, especially for writes. Sequential read is rated at 14,800 MB/s across the range. Sequential write ratings are 2,300 MB/s at 1.92TB, 4,600 MB/s at 3.84TB, 9,200 MB/s at 7.68TB, 11,800 MB/s at 15.36TB, and 10,000 MB/s at 30.72TB. Rated 4K random read performance ranges from 1.4 million IOPS at 1.92TB to 3.3 million at 7.68TB; the 15.36TB model is rated at 3.25 million. Random write ratings range from 75,000 IOPS to 600,000 IOPS, with the 30.72TB model rated at 490,000.
Those capacity-specific figures are important context for comparisons. The review’s comparison drive, Kioxia’s 7.68TB CD9P-R, has half the capacity of the tested X201P. Phison also rates its own 7.68TB version at 9,200 MB/s sequential writes, below the tested 15.36TB model’s 11,800 MB/s rating. The tested X201P’s lead in write-heavy tests is real, but shouldn’t be assumed to hold at the same size or with every model in the range.
The X201P supports the Datacenter NVMe SSD v2.0 specification, with v2.6 telemetry features, and NVMe-MI 1.2 out-of-band management over SMBus and PCIe. It offers end-to-end data protection, AES-XTS 256-bit encryption options, cryptographic erase and block erase, and up to 128 namespaces. Logical block addressing can use 512-byte or 4,096-byte sectors, with optional metadata. There are six power states, from 25W down to 12W maximum. The drive supports host-controlled thermal management, with warning and critical temperature thresholds of 77°C and 85°C.
Firmware management includes seven slots and activation without a reset. Flexible Data Placement is not supported. The tested drive ran firmware X2WM6026. The sample was the single-port ISE model XP208H0815T3P3216T310, installed in a PCIe 5.0 x4 U.2 adapter. The review notes that earlier drive data had reportedly used X2WM6025; the results discussed here were confirmed on X2WM6026.
Controller and flash
Phison did not publish full hardware details, but the 321-layer flash points to SK hynix V9 TLC. This is a three-deck design and, according to the review, flash not previously tested in one of the reviewer’s products. The X201P’s results suggest the memory contributes to its high throughput, though the tests don’t isolate flash performance from the controller and firmware.
The X2 is a 16-channel controller. The review reports that it combines Arm Cortex-R5 main cores with AndesCore RISC-V co-processors, based on information available to the reviewer rather than a complete hardware disclosure from Phison. It describes the X2 as a 12nm part, with N25F-class co-processors. Phison’s consumer E28 controller is a newer 6nm design with Andes N45 cores alongside N25F cores.
Sixteen flash channels give the X2 more parallelism to work with TLC memory. The review points out that enterprise SSDs in this class don’t rely on pseudo-SLC as a way to boost writes, so the controller and flash arrangement must sustain performance from TLC itself. For comparison, the 16-channel Marvell Bravera SC5 and Silicon Motion SM8366 use Arm cores throughout, while Phison pairs its Arm cores with RISC-V co-processors.
Testing setup and comparison
The main comparison is Kioxia’s 7.68TB CD9P-R, a read-intensive PCIe 5.0 TLC drive rated at 1 DWPD. The products use different form factors: the X201P is U.2, while the Kioxia is E3.S. Both were tested with 512-byte sectors. Form factor shouldn’t determine performance by itself, though it can affect temperature results.
Testing used an Intel Xeon 658X system with an Asus Pro WS W890E-SAGE SE motherboard, 64GB of DDR5-5600 RDIMM memory, Debian 13 with Linux 7.2.6, and fio 3.42. The X201P connected through a PCIe 5.0 x4 U.2 adapter. Tests used io_uring and direct I/O against the raw block device, bypassing the file system and page cache. Deep CPU sleep states were blocked during runs to reduce wake-up delays in low-queue-depth measurements.
The suite uses interrupt-driven I/O with IOMMU enabled, reflecting common Linux defaults for databases, file systems and virtual machines. Drives were securely erased, formatted to 512-byte sectors where supported, preconditioned, and written with random data until performance stayed steady for 30 minutes. The team repeated results when a test showed a brief dip or deviated from neighboring points. Three X201P sweep results were remeasured; charts use the new measurements.
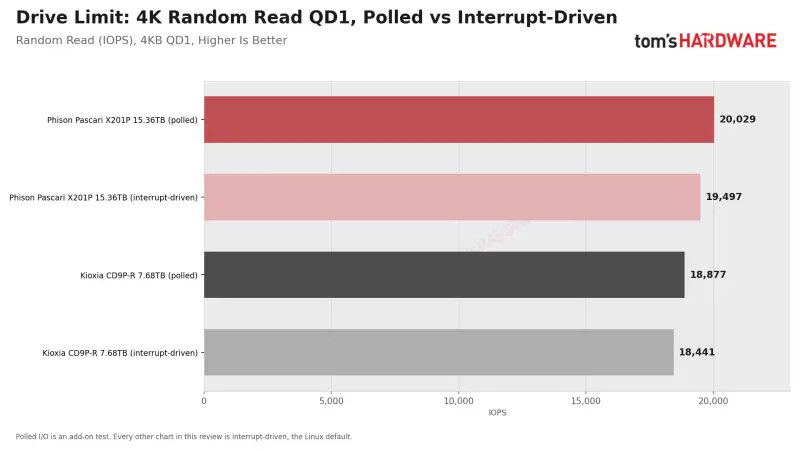
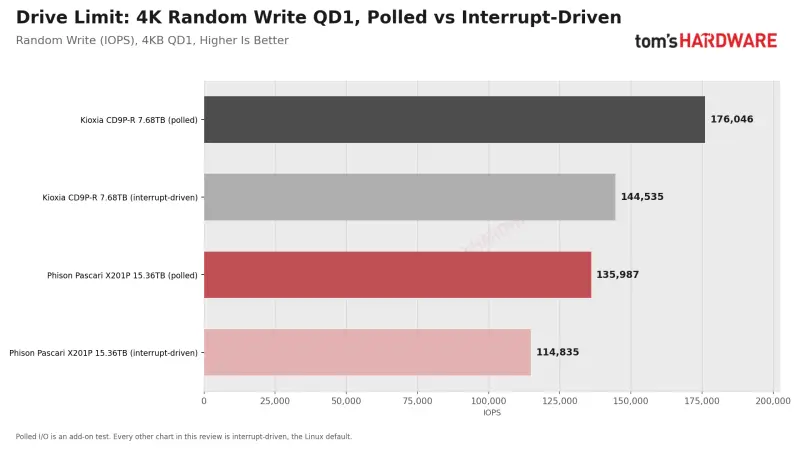
That testing choice affects comparisons with vendor ratings. Polled I/O can raise QD1 results and the peak 4K random read figure, but it keeps a CPU core busy for each job. The review reports both modes where needed. Its main results describe interrupt-driven behavior; polled results provide a view of the drive’s ceiling. A full run took about 16 hours.
Sequential throughput and random I/O
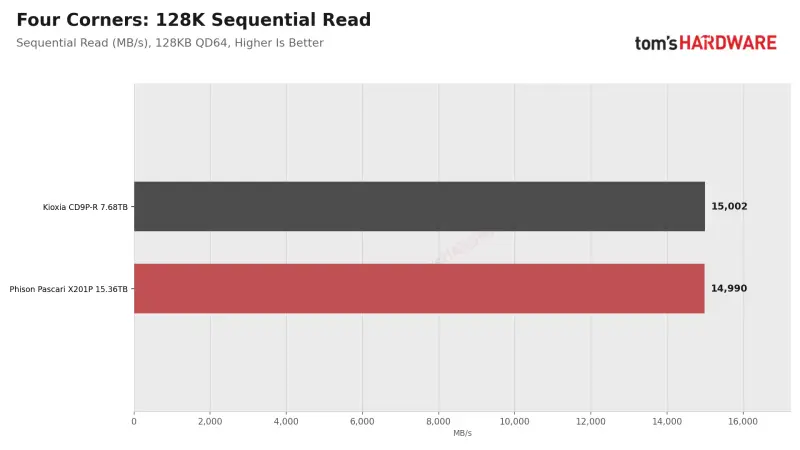
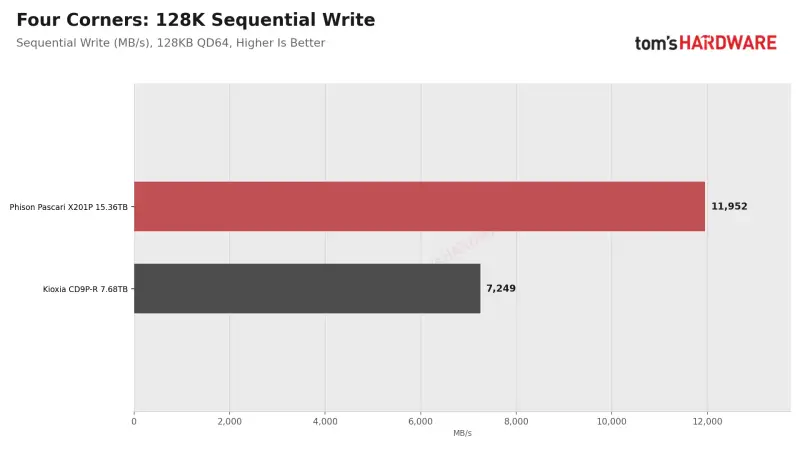
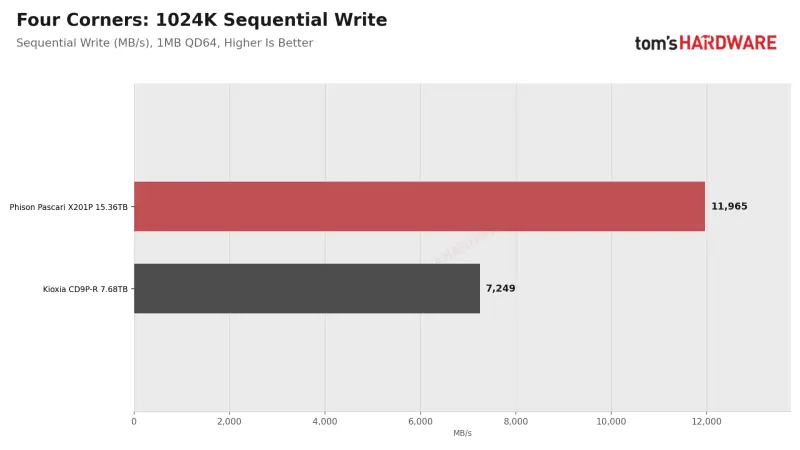
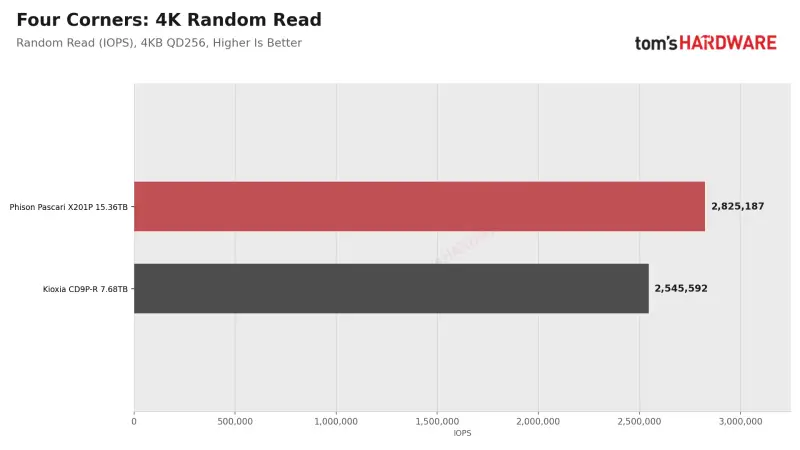
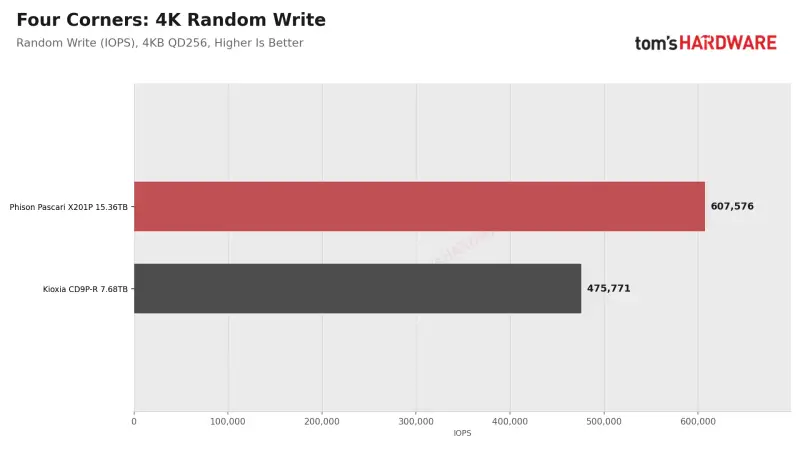
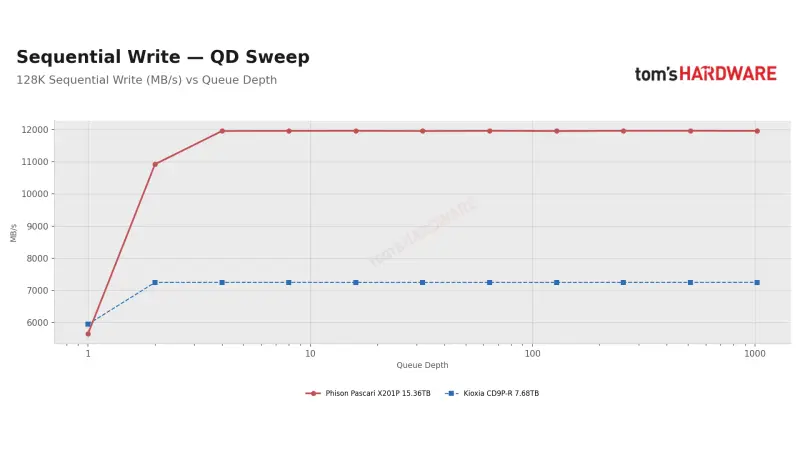
The clearest advantage appears in sustained writes. In the four headline tests—sequential reads and writes, plus 4K random reads and writes—the X201P beat or matched its rated figures. It delivered about 12 GB/s of sequential write throughput, compared with 7.2 GB/s for the CD9P-R. Its 4K random write result was 608,000 IOPS, against 476,000 for Kioxia. The X201P’s 4K random write figure remained the same when repeated hours later.
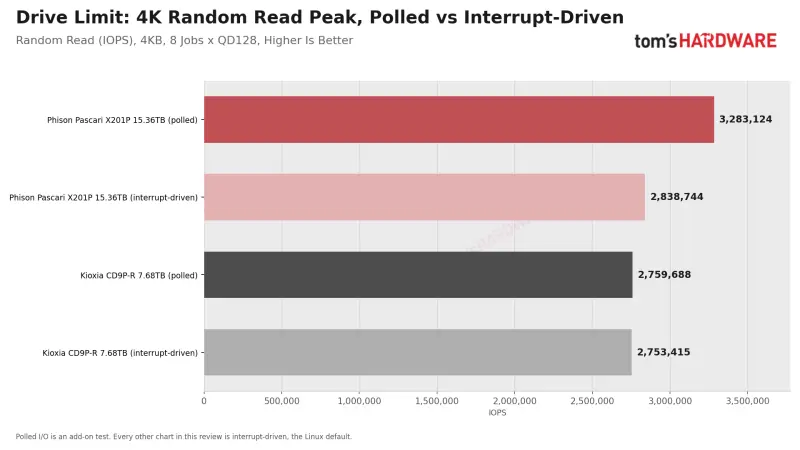
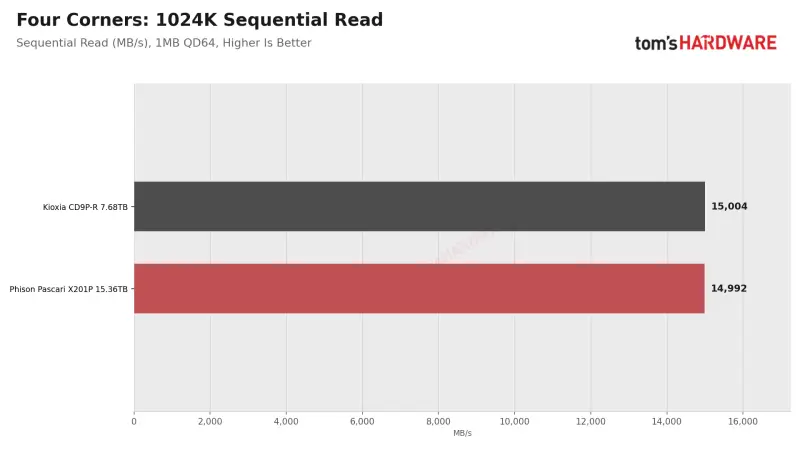
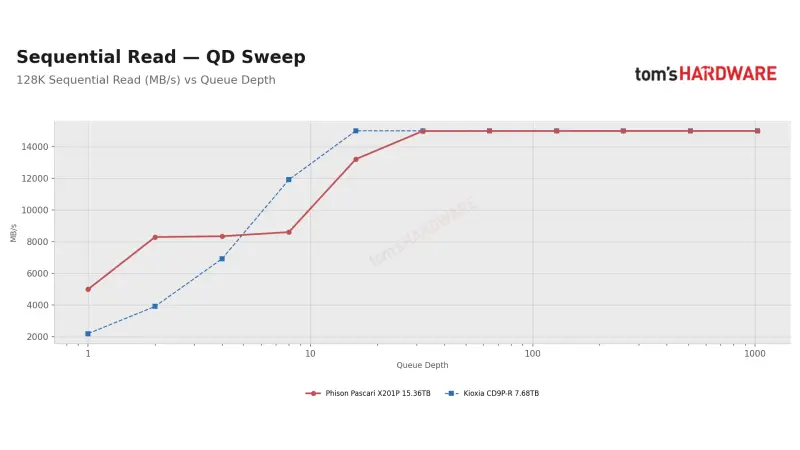
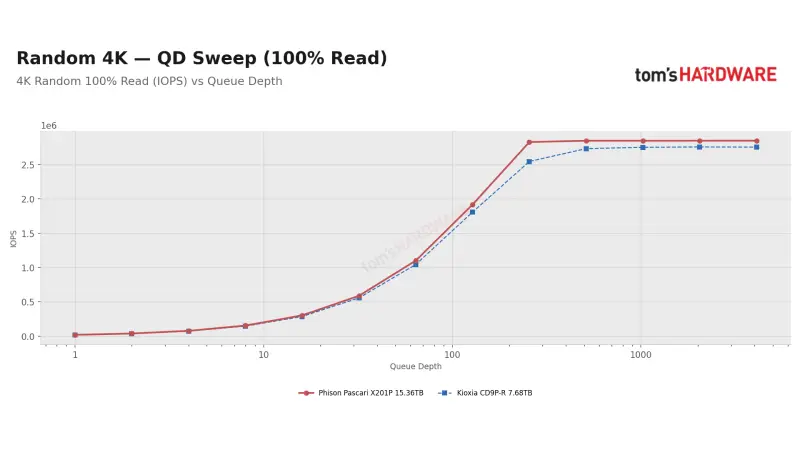
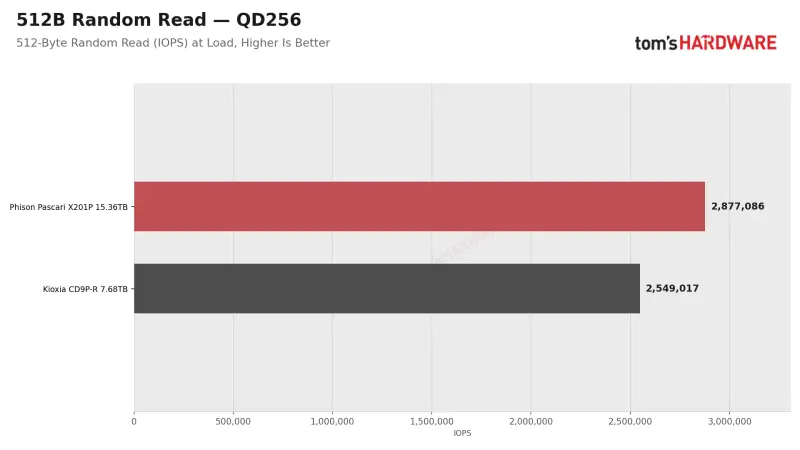
Sequential read was effectively a tie: both drives reached the PCIe 5.0 link limit, around 15 GB/s. The X201P’s random read result exceeded Phison’s 3.25 million IOPS rating when tested with polled I/O, reaching 3.283 million at the specified queue depth. The interrupt-driven test topped out around 2.84 million, reflecting the test system’s limit rather than the SSD’s full capability. Without polling, the X201P still led the CD9P-R in the tested 4K read range.
Queue depth changes the sequential read picture. At QD1 with 128K transfers, the X201P read at 5.0 GB/s, more than twice the CD9P-R’s result. The X201P then sat around 8.3–8.6 GB/s between QD2 and QD8, and needed QD32 to reach full speed. The CD9P-R reached full speed by QD16 and led at QD8. At deeper queues using 1MB transfers, however, the X201P held its rate while the Kioxia dropped: the gap reached 6% at QD512 and 13% at QD1024.
For sequential writes, the X201P reached full speed by QD2 with 1MB transfers and by QD4 with 128K transfers, then held close to 12 GB/s. It was 65% faster than the CD9P-R at every tested depth beyond QD2. That low queue depth requirement is useful for systems that can maintain a small number of outstanding write requests, while the drive also retains its advantage under heavier load.
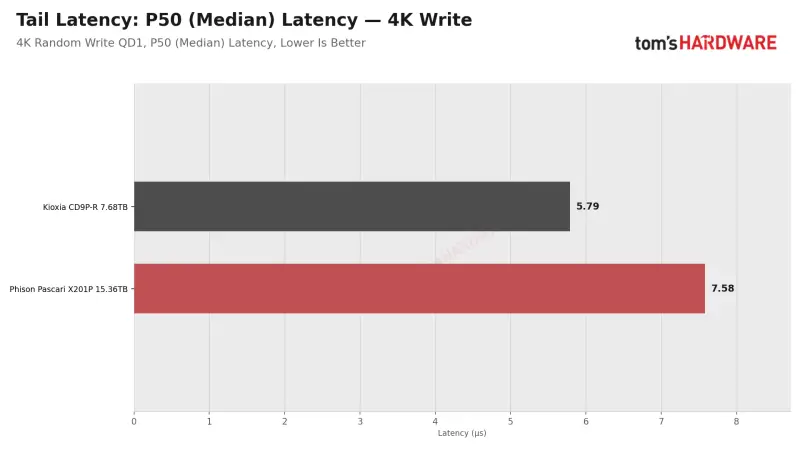
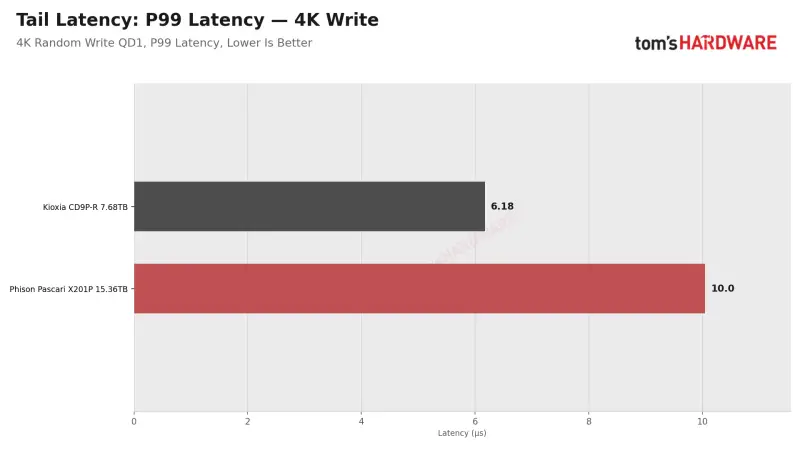
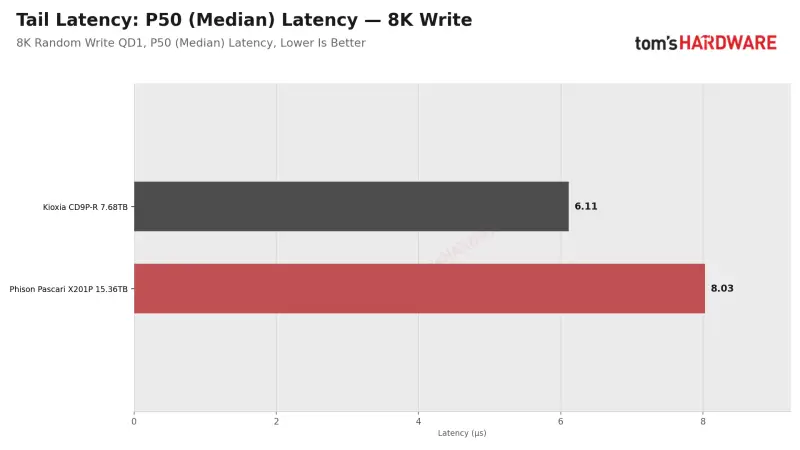
Random writes show the opposite pattern at the lightest load. At QD1, the X201P recorded 114,000 IOPS at 7.7 microseconds; the CD9P-R delivered 144,000 at 5.8 microseconds. At QD2, Kioxia led by 20%. The X201P’s QD1 result still fell within Phison’s 8-microsecond rating. From QD4, Phison’s drive took the lead, reaching about 610,000 IOPS by QD8 and holding that level through QD4096.
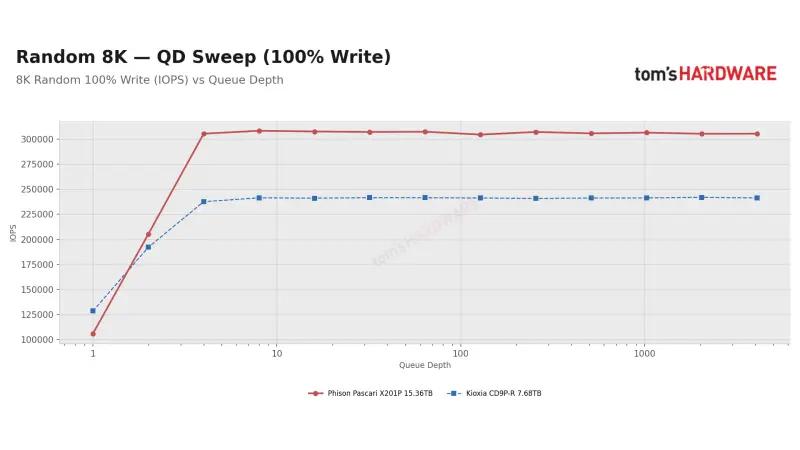
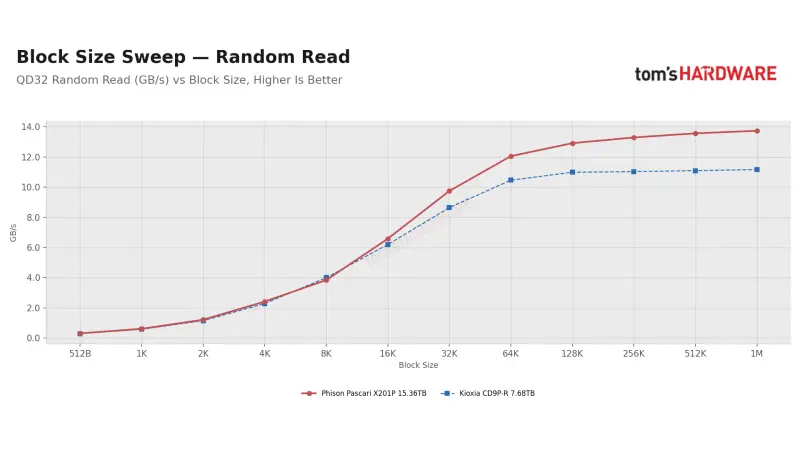
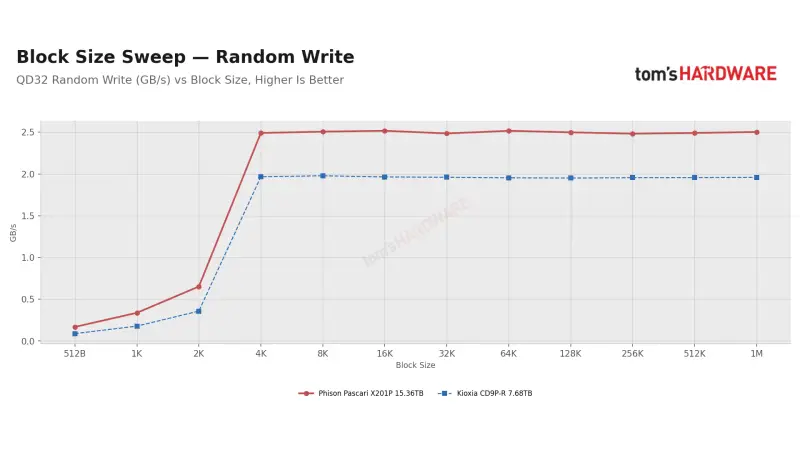
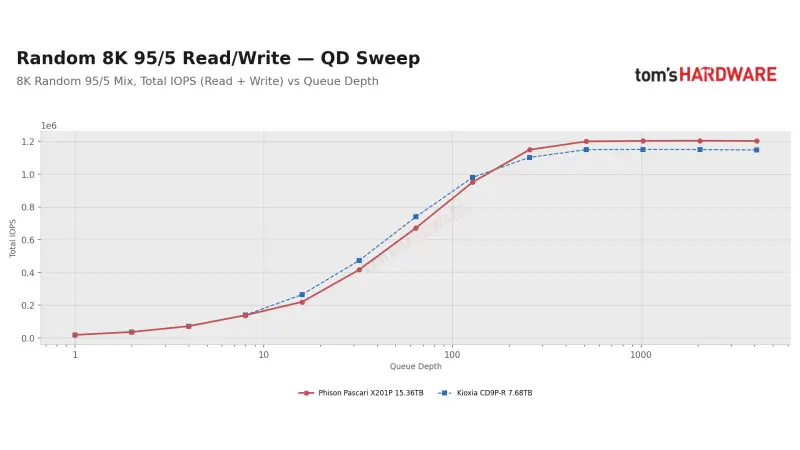
At 8K, often used for database pages, the X201P’s read curve has a dip around QD16. The CD9P-R led there by 17%, though the X201P later reached a peak 20% higher. Across the block-size sweep, X201P random writes below 4K reached 319,000–330,000 IOPS, compared with 174,000 for Kioxia. From 4K upward, write bandwidth stayed near 2.5 GB/s on the Phison drive and 2.0 GB/s on the CD9P-R. The sub-4K advantage applies to software issuing those small writes on a 512-byte format.
Mixed loads, latency and sustained writes
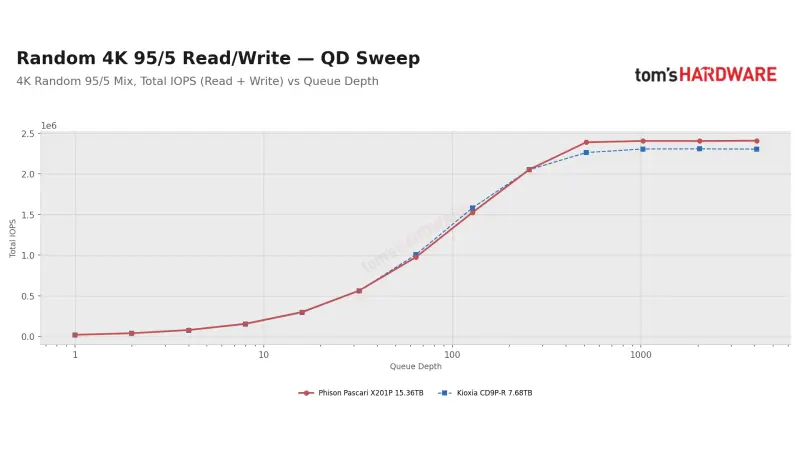
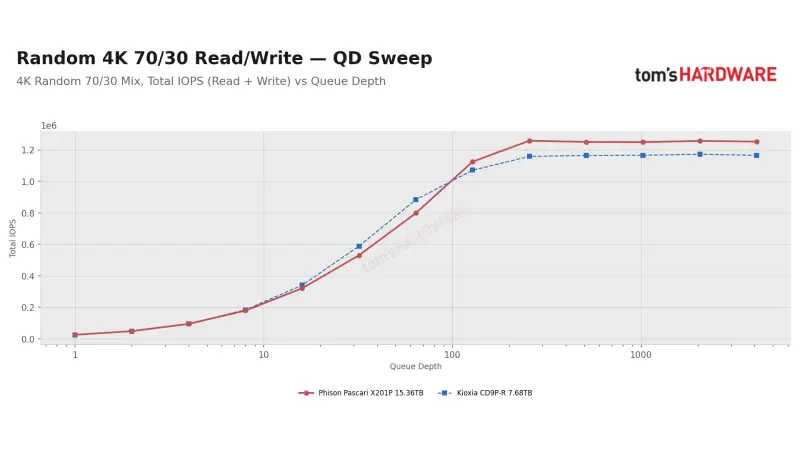
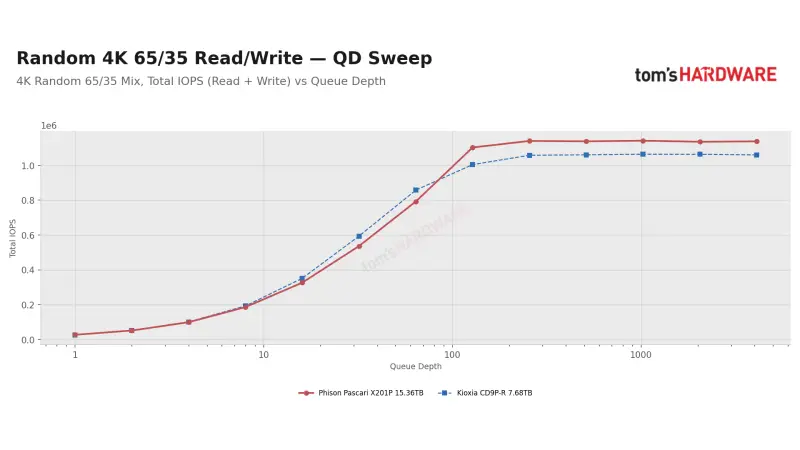
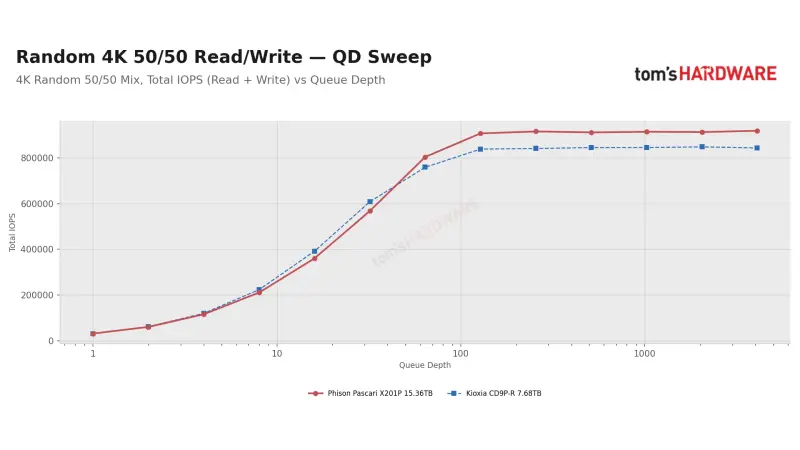
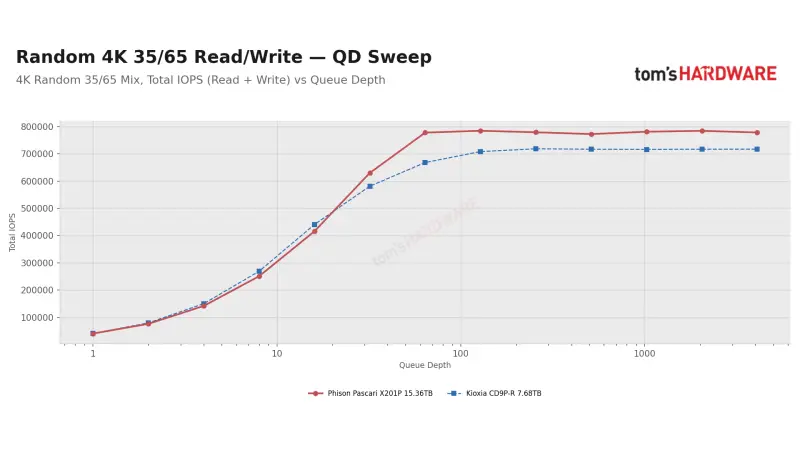
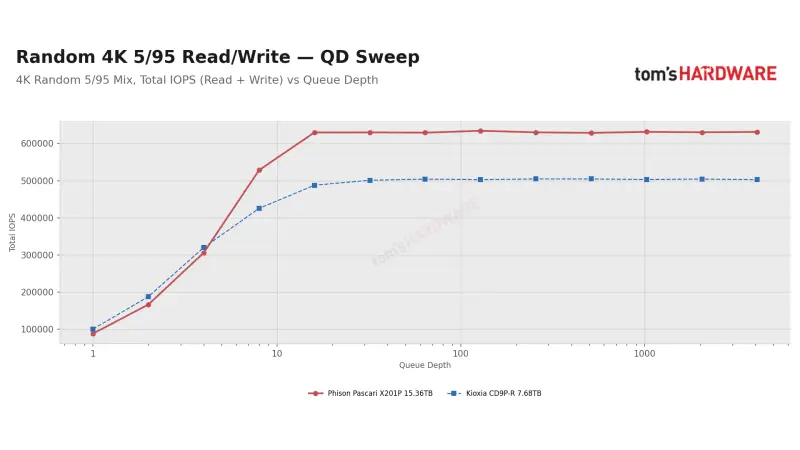
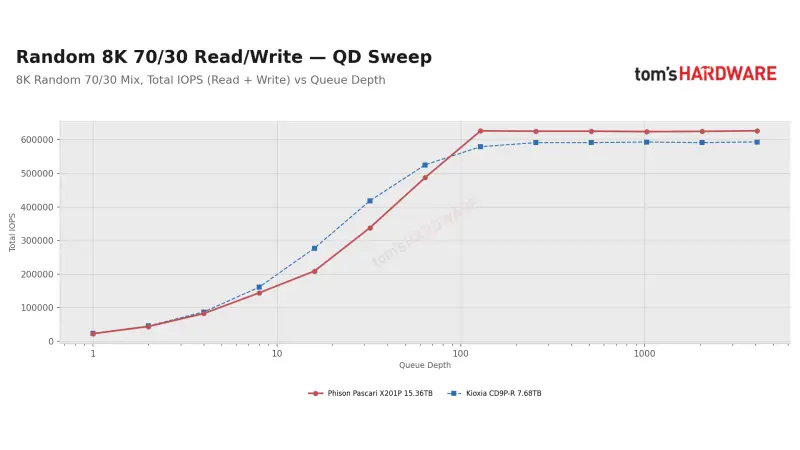
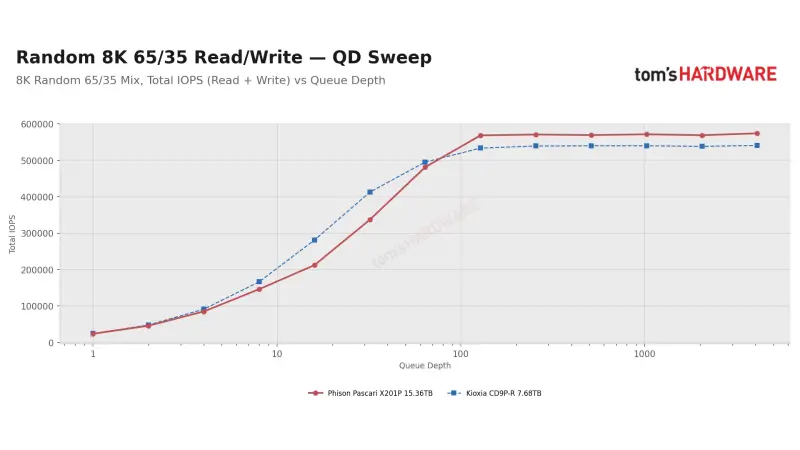
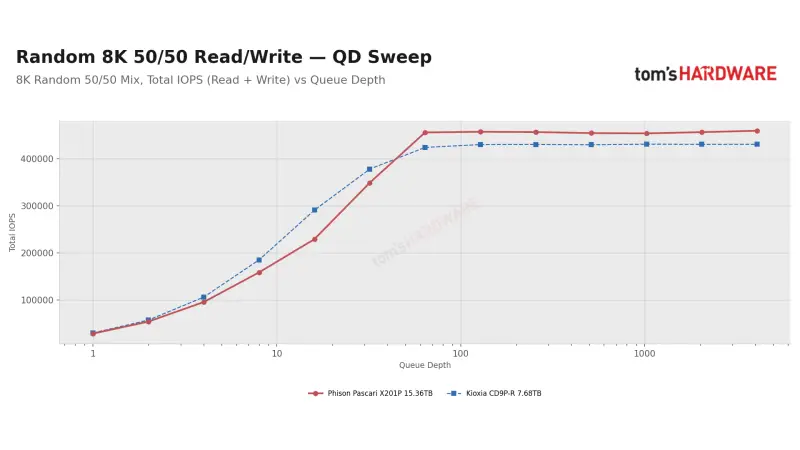
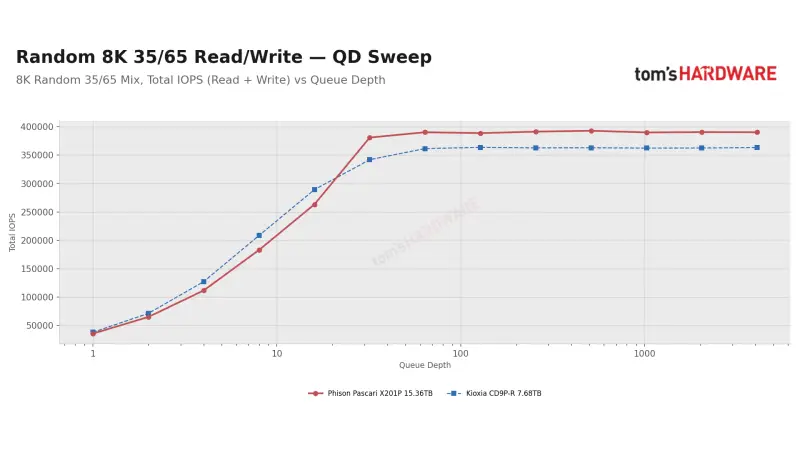
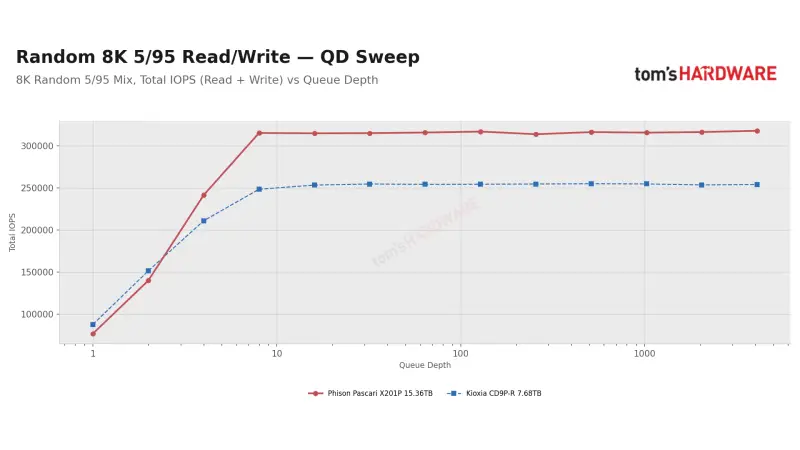
Under saturated mixed workloads, the X201P usually led by 4–9%, and by about 25% when the workload was almost entirely writes. In the 4K 70/30 test, a common stand-in for transactional database activity, it exceeded one million IOPS at QD128 and leveled off at 1.25 million. Yet at moderate queue depths—roughly QD4 to QD64—the half-capacity CD9P-R delivered more IOPS in most mixes, by as much as 11% at 4K and 33% at 8K.
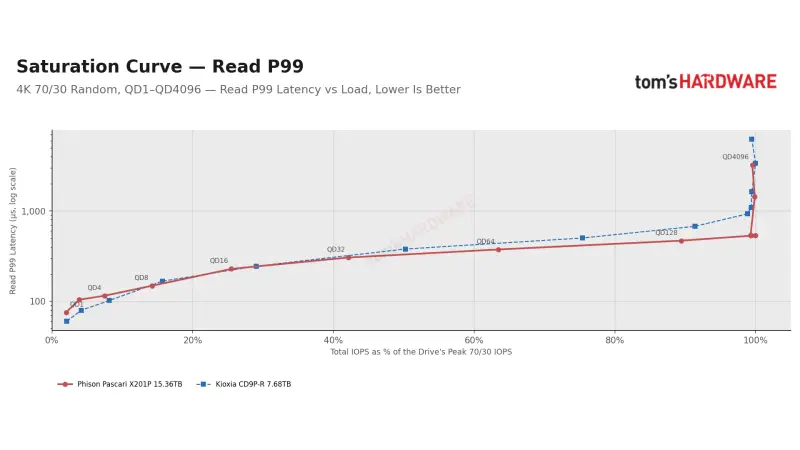
As the write share increased, the X201P took the lead at a lower queue depth. It also produced tighter read tail latency in the 4K 70/30 mix: from QD1 to QD32, its P99.99 read latency was about half the CD9P-R’s. That distinction matters for systems where a small number of slow requests can affect service response even when total throughput looks good.
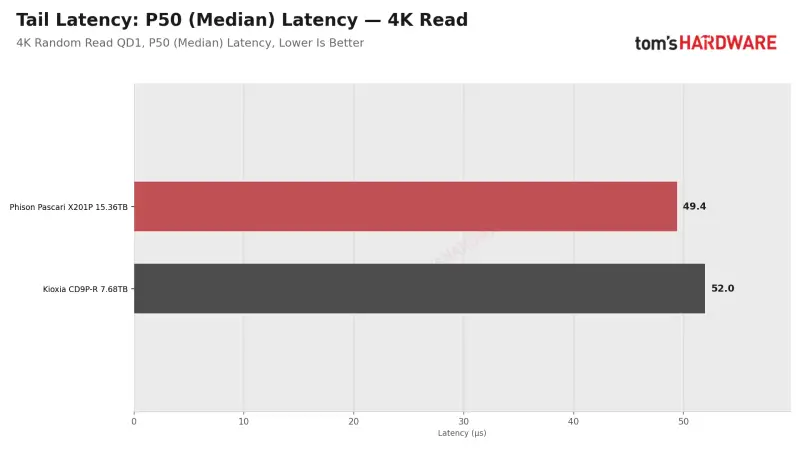
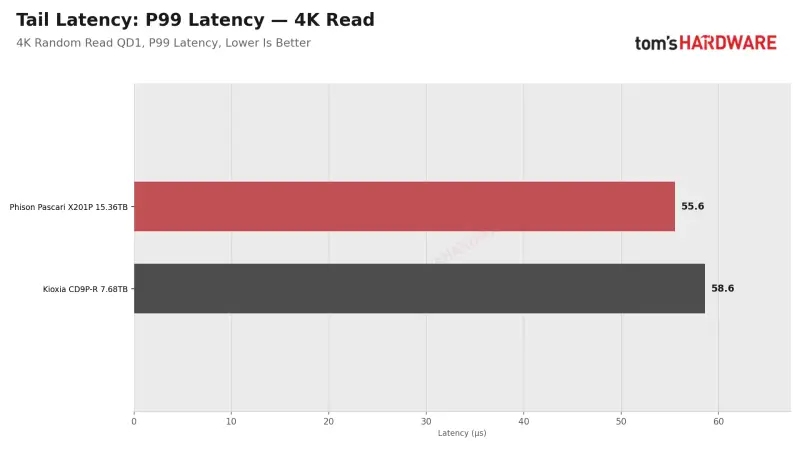
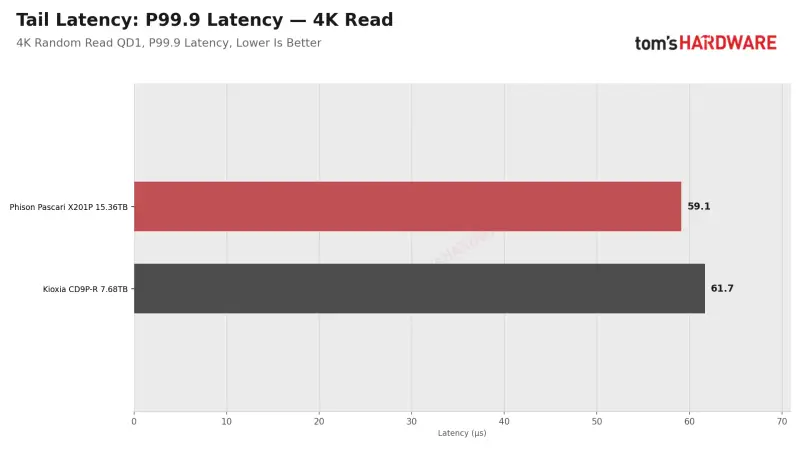
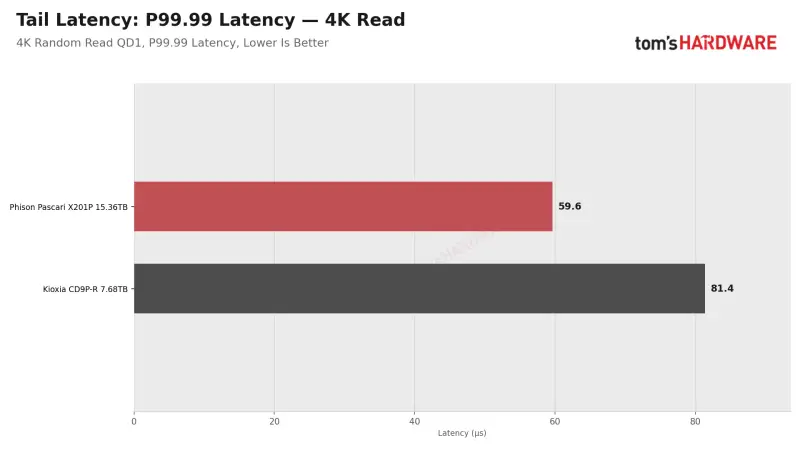
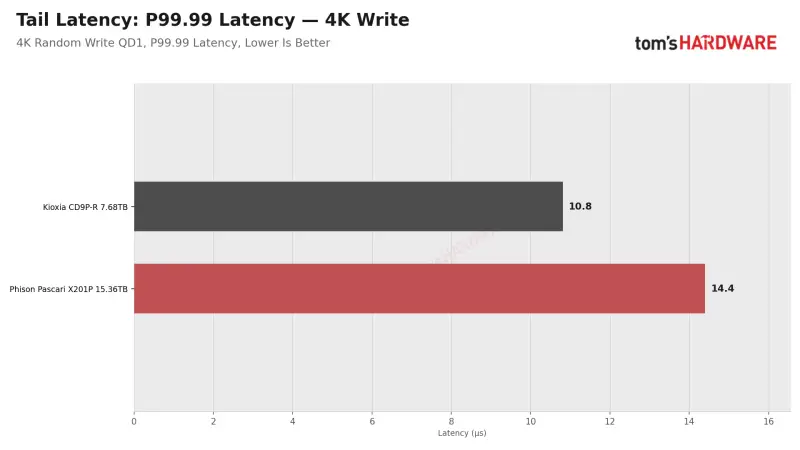
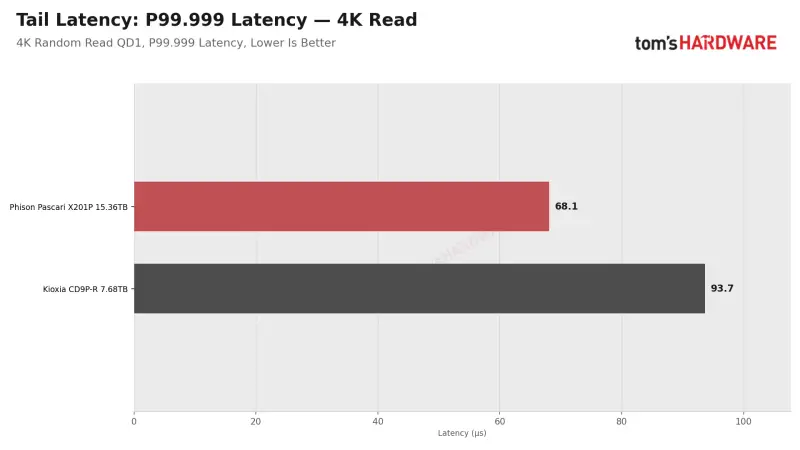
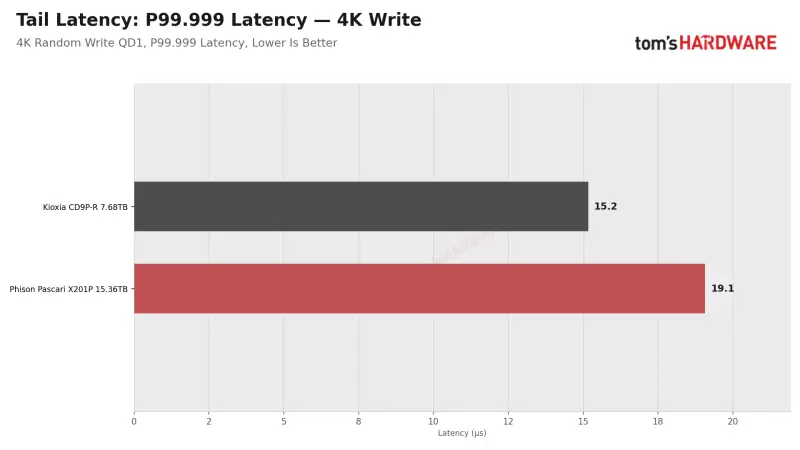
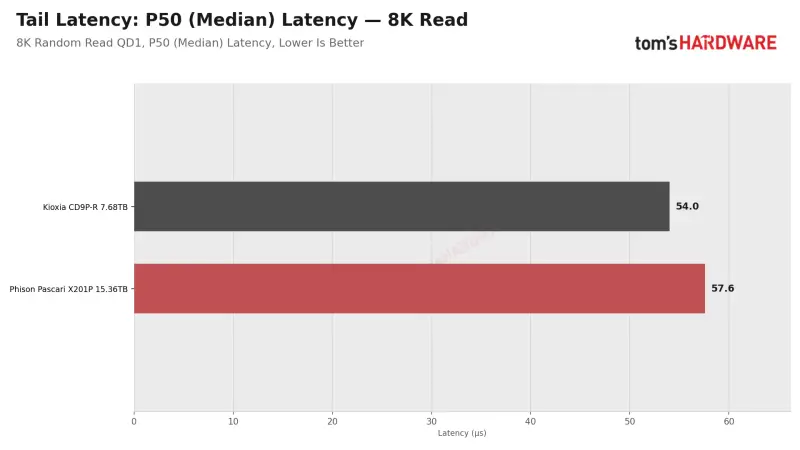
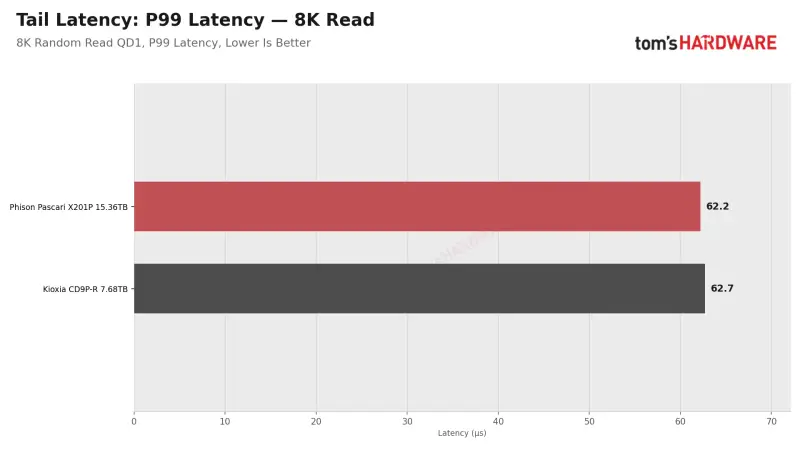
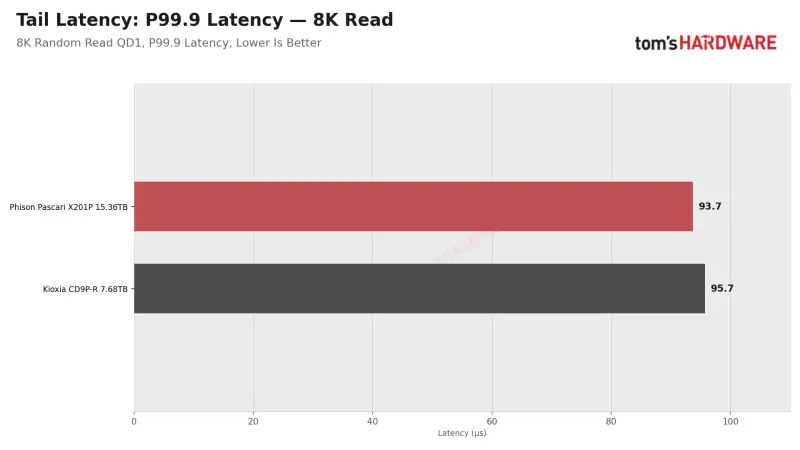
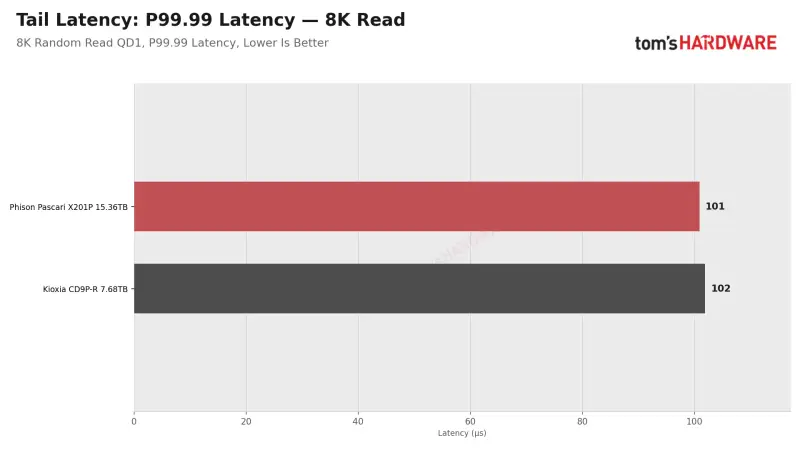
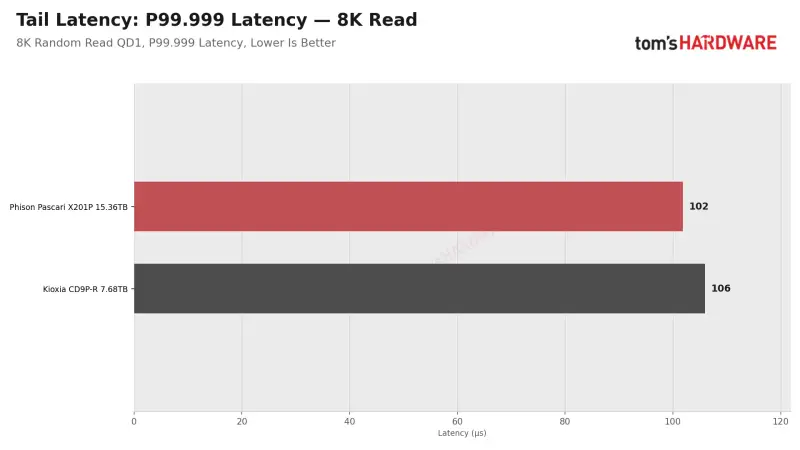
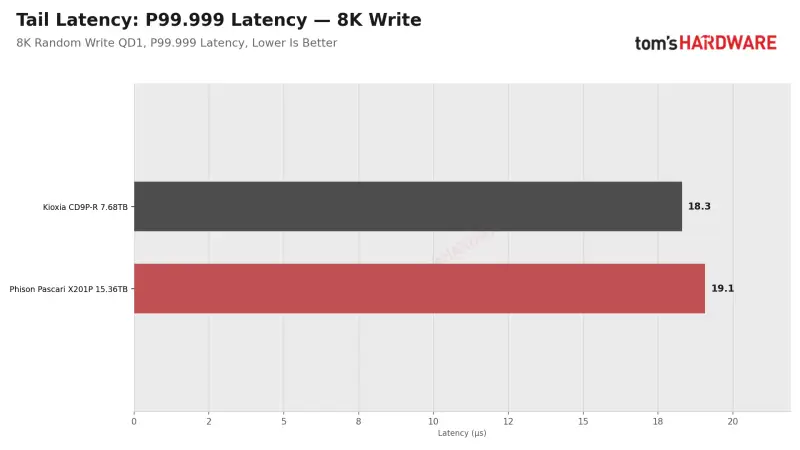
The tail-latency results show a similar split. On reads, the X201P was slightly quicker in the headline 4K test and had a cleaner deep tail: its QD1 P99.99 was 60 microseconds, compared with 81 microseconds for Kioxia. At 8K, results were broadly comparable except for the X201P’s QD16 weakness. Its 4K QD1 average read latency was 50.4 microseconds, within Phison’s 55-microsecond rating.
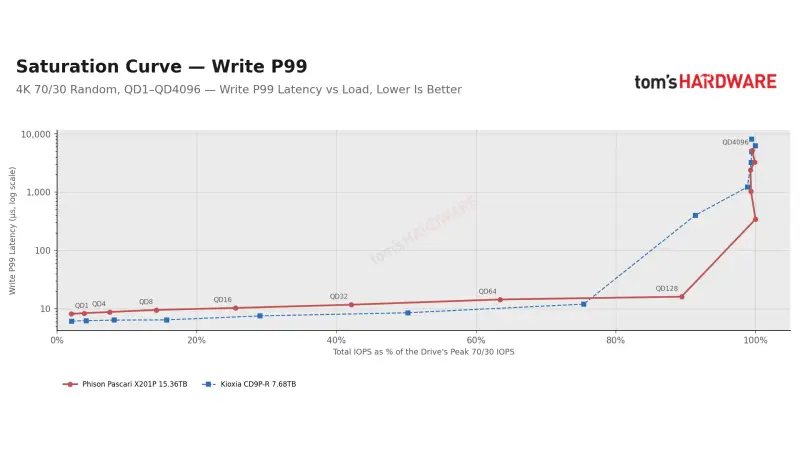
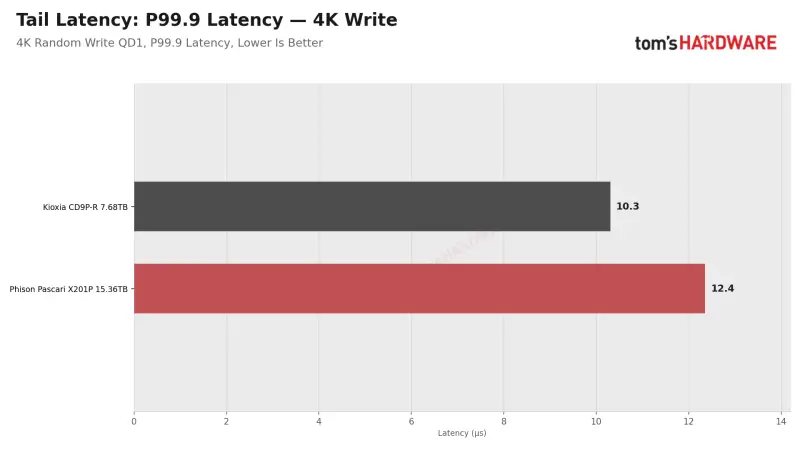
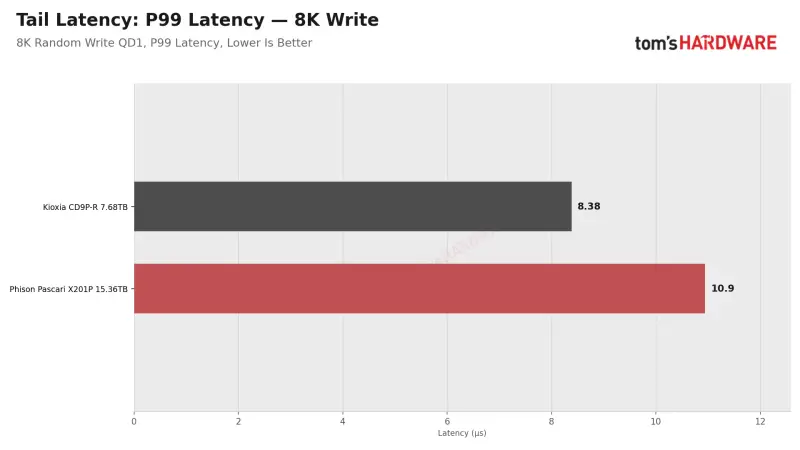
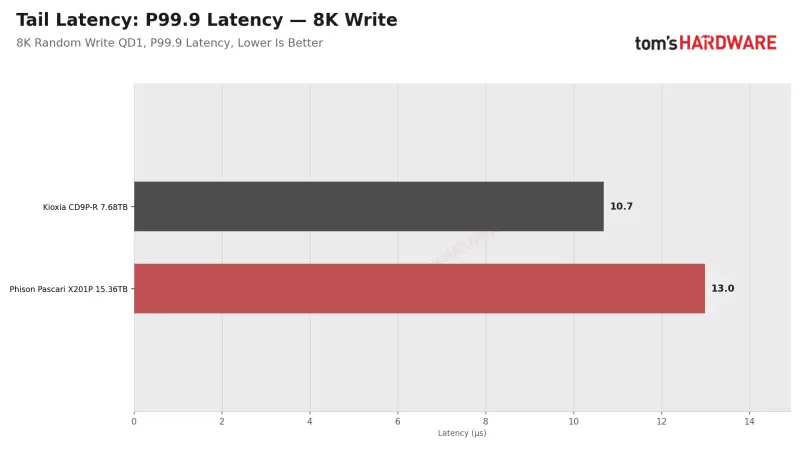
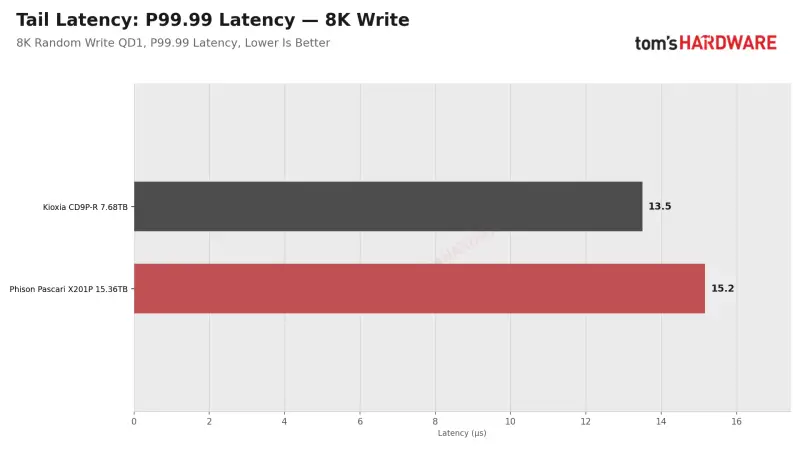
On writes, Kioxia was quicker at QD1. With a queue, the X201P’s response became more predictable. Its 4K write P99 stayed within about 2.5 microseconds of its median at QD1, QD4 and QD16. At QD16, its P99 was 27 microseconds, against 75 microseconds for the CD9P-R. Kioxia still completed most writes sooner, but a larger share of its requests waited much longer.
The review’s QD1 latency values include roughly 1.2–1.4 microseconds of overhead from interrupt-driven completion and IOMMU being enabled. Those results therefore aren’t directly comparable with tests using polling or with IOMMU disabled.
At 89% of its peak 4K 70/30 throughput, the X201P handled 1.12 million IOPS with a write P99 of 16 microseconds. Pushing the final step to peak throughput raised that latency sharply to 342 microseconds for 12% more IOPS. The CD9P-R reached a similar latency wall earlier, between 75% and 91% of its peak; its practical operating point was about 880,000 IOPS. Around 1.1 million IOPS, the X201P’s write P99 was 16 microseconds and the Kioxia’s was 399 microseconds.
Steady-state behavior and recovery
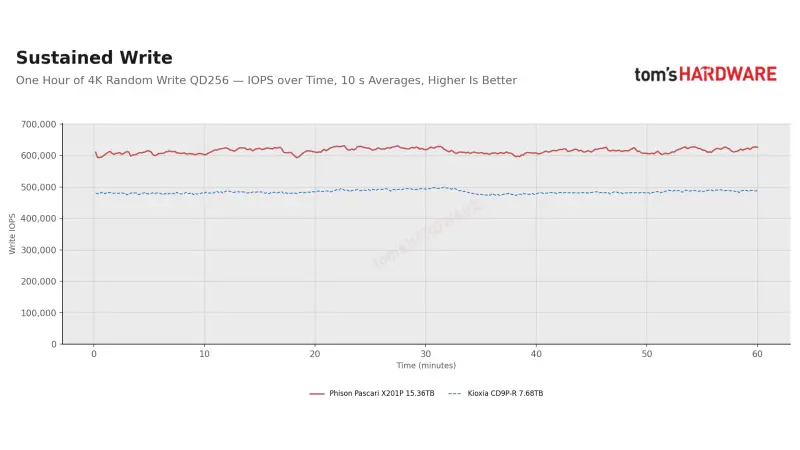
During an hour of 4K random writes at QD256, the X201P sustained 615,000 IOPS, 2.4% above its 600,000 rating and 27% ahead of the CD9P-R. Its performance trace remained flat, without the dips or sawtooth pattern that can signal uneven background cleanup. Write P99 latency was 428 microseconds, compared with 1,204 microseconds for Kioxia. The CD9P-R had a lower median, 383 microseconds versus 416 microseconds.
That sustained result is a useful planning figure: about 610,000 IOPS, or roughly 2.5 GB/s, under the tested conditions. The drive’s write rate stayed within 1.4% of its other steady-state readings during the run after a QD32 point was remeasured.
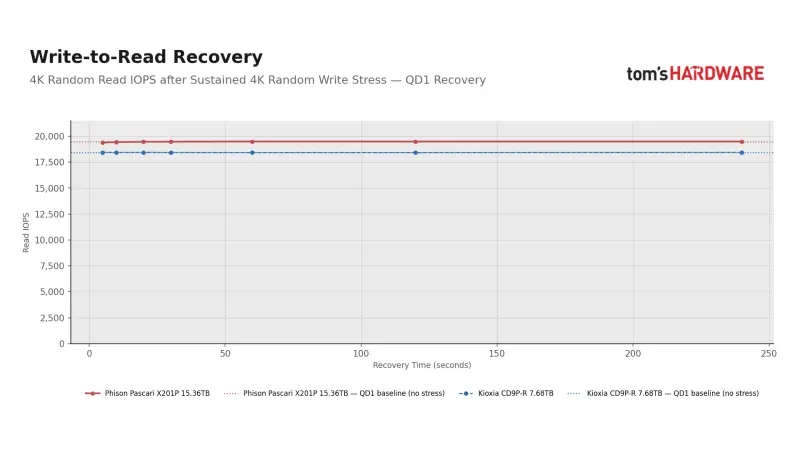
Heavy writes did not cause an immediate drop in the X201P’s subsequent QD1 read throughput. In the first five seconds after a write burst, read speed stayed within half a percent of normal. Looking deeper into the latency tail, P99.99 reads took 210 microseconds for the first ten seconds after the write, compared with a normal 60 microseconds; the result returned to normal by 20 seconds. The deepest measured tail took about a minute to settle. Kioxia’s drive showed no corresponding recovery effect.
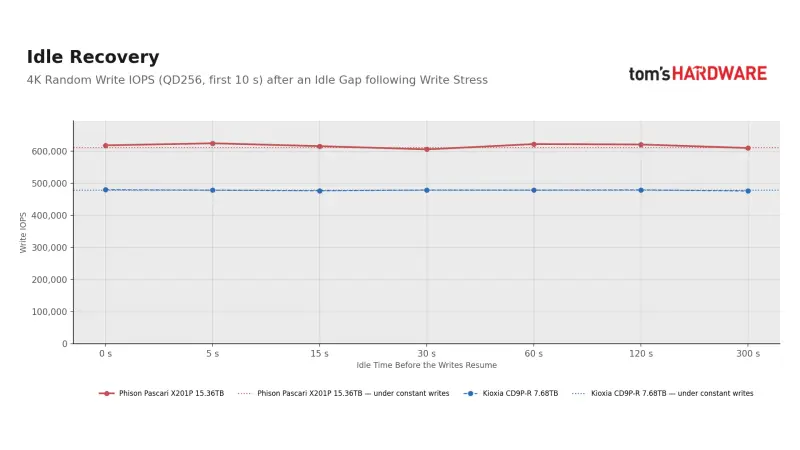
Five minutes of idle time did not meaningfully improve the X201P’s next write burst. Its 10-second write rate stayed within about 2% of the rate after no rest. Each burst began with a one-second spike 6–20% above the constant rate, but the spike also appeared without idle time, so it wasn’t evidence of cleanup completed during the break.
Database and AI workloads
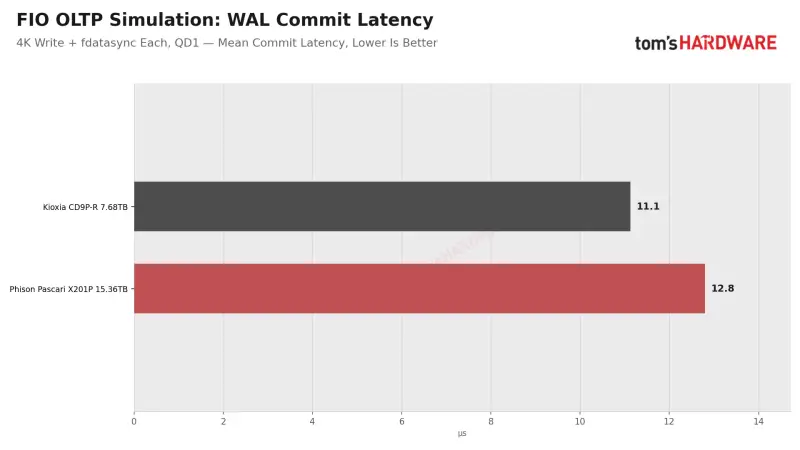
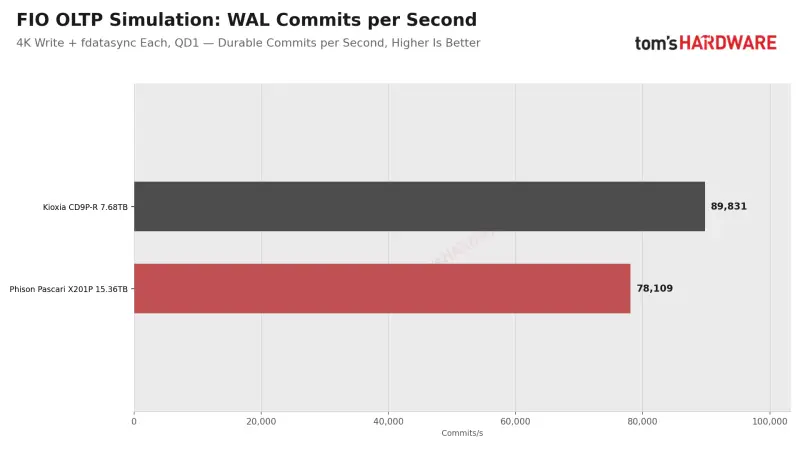
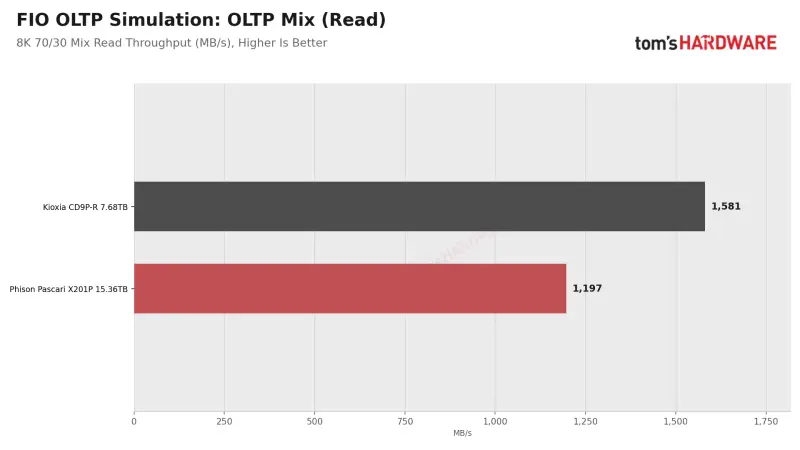
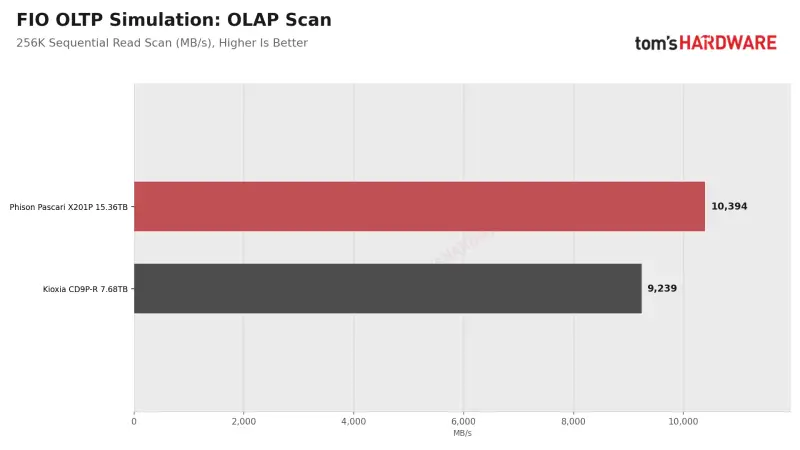
The database simulations favored different drives depending on the task. For 4K sequential log commits at QD1, the X201P recorded 78,000 commits per second, below the CD9P-R’s 90,000. In the 8K random 70/30 page workload at QD16, it reached 209,000 IOPS, against 276,000 for Kioxia. The Phison drive did deliver lower P99 read latency in that page test—322 microseconds versus 428—and won the 256K sequential analytics scan by 12.5%, at 10.4 GB/s versus 9.2 GB/s.
These simulations represent moderate-load patterns rather than a complete database deployment. At QD128 and above in the same 8K 70/30 mix, the X201P was faster. The practical distinction is straightforward: the CD9P-R suits moderate-load transactional work better in these tests, while the X201P is stronger for analytics scans and heavily loaded mixes.
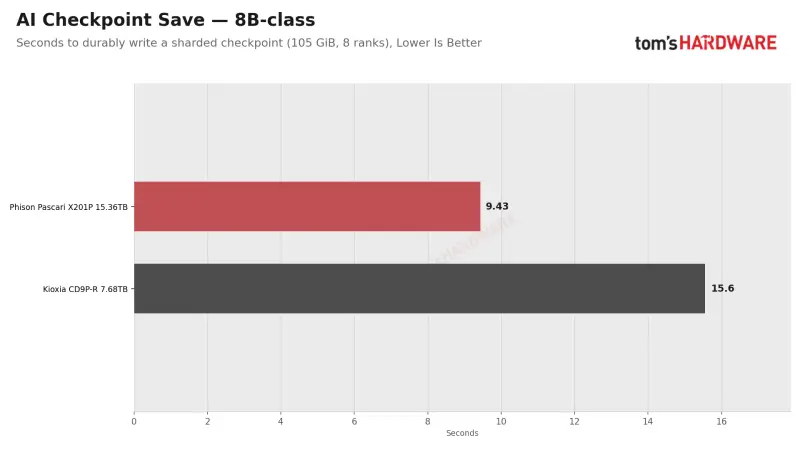
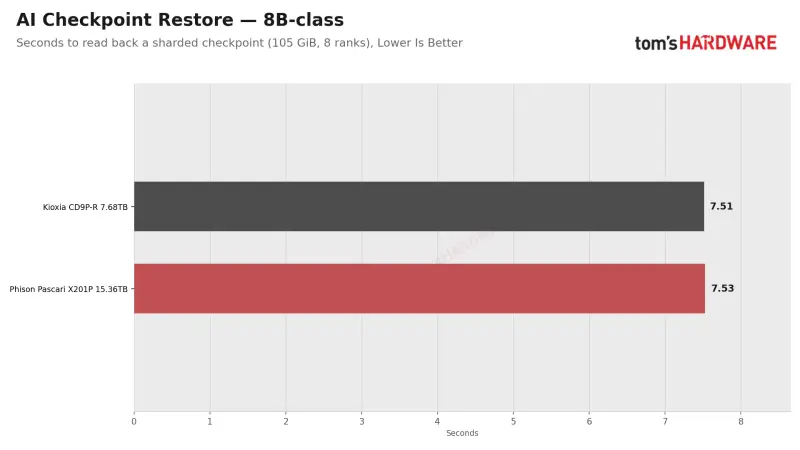
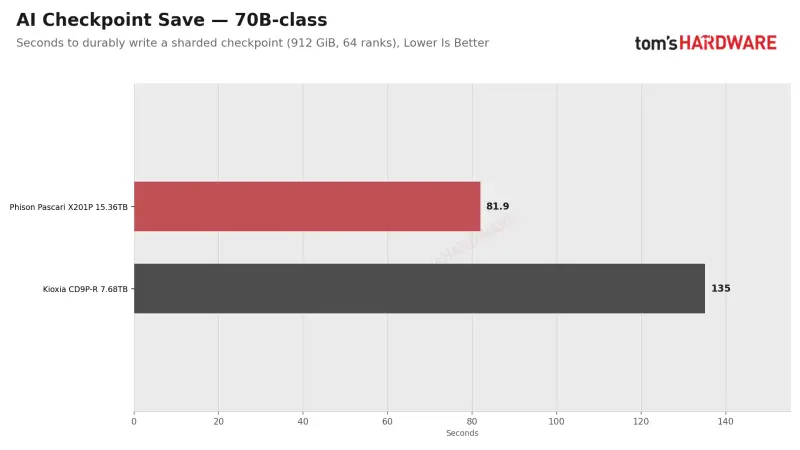
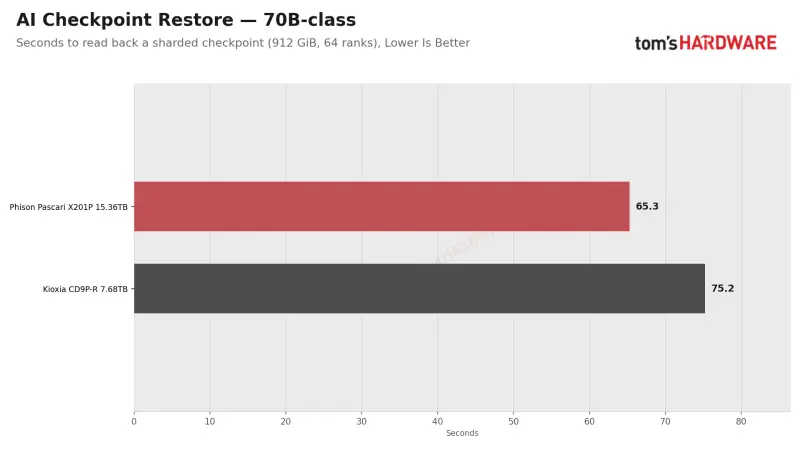
AI checkpointing is the X201P’s clearest application win. The test modeled an 8B-class model checkpoint of 105GiB divided among eight writers, and a 70B-class checkpoint of 912GiB divided among 64. Each writer used 1MB transfers, and restore tests read the data back. Results measured the time until the last writer finished.
Both saves ran at the X201P’s roughly 12 GB/s write rate and finished 39% sooner than on the CD9P-R. The 8B-class save took 9.4 seconds versus 15.6 seconds; the 70B-class save took 82 seconds versus 135. The smaller restore was tied at 7.5 seconds, limited by the link. The larger restore took 65 seconds on the X201P and 75 on Kioxia, a 13% reduction. At the tested capacity, the checkpoint save advantage follows directly from the Phison drive’s higher sequential write bandwidth.
The 7.68TB X201P may show a smaller gap because Phison rates it at 9,200 MB/s sequential writes, compared with 11,800 MB/s for the tested 15.36TB model. That rating is still above Kioxia’s 7,000 MB/s figure for the CD9P-R.
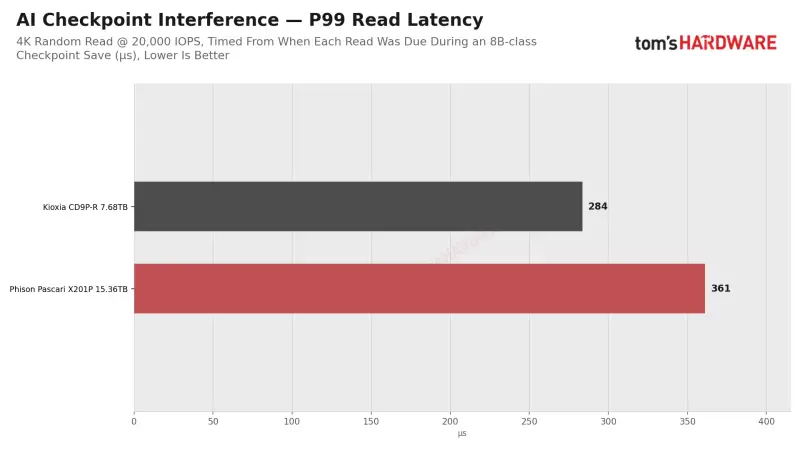
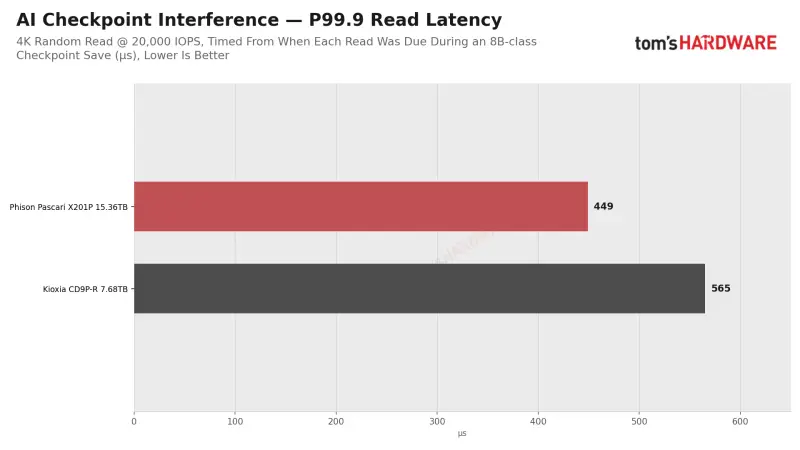
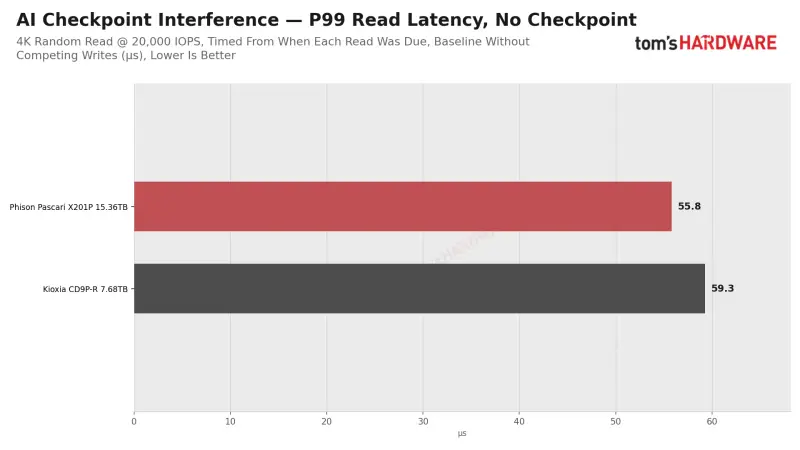
A separate interference test measured 20,000 4K random reads per second while an 8B checkpoint save ran. Both drives saw higher read latency during the save. The X201P’s P99 rose from 56 to 361 microseconds, while the CD9P-R moved from 59 to 284. Median read latency also climbed more on Phison’s drive, to 145 microseconds versus 85 for Kioxia. At P99.9, the result reversed: 449 microseconds for the X201P and 565 for the CD9P-R. At P99.999, the CD9P-R was lower, 1.4 milliseconds versus 3.1.
The checkpoint finished 39% faster on the X201P, so the interference lasted for less time. The test doesn’t establish why the drives differ at each latency percentile, but it shows that a faster save does not necessarily mean less disruption for every request during that save.
Thermals and buying considerations
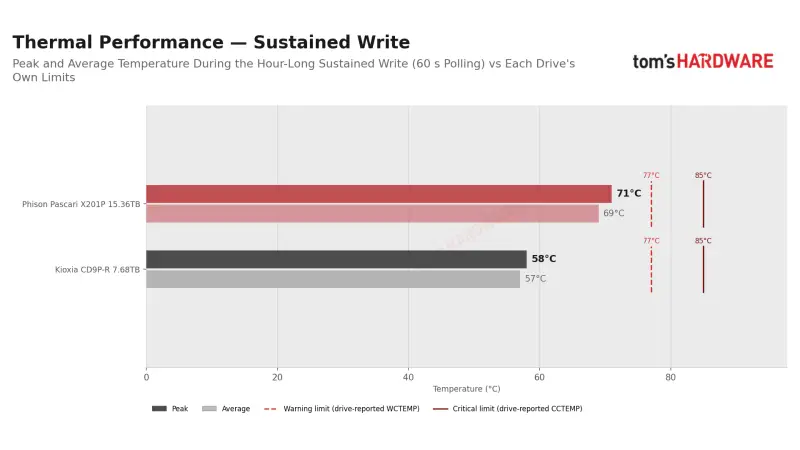
During the sustained write test, the X201P reached 71°C and averaged 69°C, 6°C below its 77°C warning threshold. It reached that peak about 18 minutes into the hour and remained there. The drive’s log recorded two thermal-management events totaling seven seconds, though it didn’t identify which test triggered them. Performance remained steady throughout the write run.
The CD9P-R peaked at 58°C, 19°C below its warning threshold, with less directed airflow and no logged thermal events. This isn’t a direct thermal comparison: the drives use different form factors, and the X201P was writing more data. The X201P cooled from about 60°C to 44°C after five minutes of idle time.
Phison did not provide pricing for the X201P, so the review couldn’t compare purchase cost with the CD9P-R, which was priced at roughly $700 per terabyte. That missing figure leaves an important deployment question open. The X201P’s performance case is strongest when its write bandwidth and capacity translate into shorter checkpoints or greater throughput per drive; procurement decisions still need a price and endurance calculation for the chosen capacity.
The 15.36TB Pascari X201P met or exceeded its testable ratings, sustained about 12 GB/s sequential writes, and delivered more than 600,000 random write IOPS under long-duration load. Its biggest compromises show up in QD1 writes, database log commits, some moderate-load mixed tests and 8K reads around QD16. For checkpoint-heavy AI nodes, ingest systems and heavily loaded mixed workloads, it looks like a capable option. Teams prioritizing moderate-load transaction latency should compare those specific results with their own request patterns before choosing a capacity.